# Creating bar charts
This section describes how to create bar charts with the Visualization API and qlik-visual.
## Creating a basic bar chart
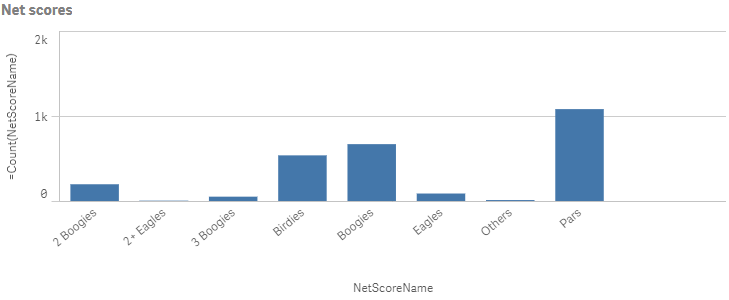
In this example we want to create a basic bar chart, containing one dimension and one measure, and with a custom title.
1. Create the chart
Create the container for the chart. The visualization type is barchart.
Visualization API
```
app.visualization.create(
'barchart',
[],
{}
)
```
qlik-visual
```
```
2. Define the dimension and the measure as columns
```
[
"NetScoreName",
"=Count(NetScoreName)"
]
```
3. Define the title in the options
```
{
"showTitles": true,
"title": "Net scores"
}
```
### Result
### Code examples
[](https://help.qlik.com/en-US/sense-developer/Subsystems/Mashups/Content/Sense_Mashups/Create/Visualizations/Barchart/create-barchart.htm)
#### Visualization API
```
app.visualization.create(
'barchart',
[
"NetScoreName",
"=Count(NetScoreName)"
],
{
"showTitles": true,
"title": "Net scores"
}
).then(function(vis){
vis.show("QV01");
});
```
[](https://help.qlik.com/en-US/sense-developer/Subsystems/Mashups/Content/Sense_Mashups/Create/Visualizations/Barchart/create-barchart.htm)
#### qlik-visual
```
```
## Sorting and presentation settings
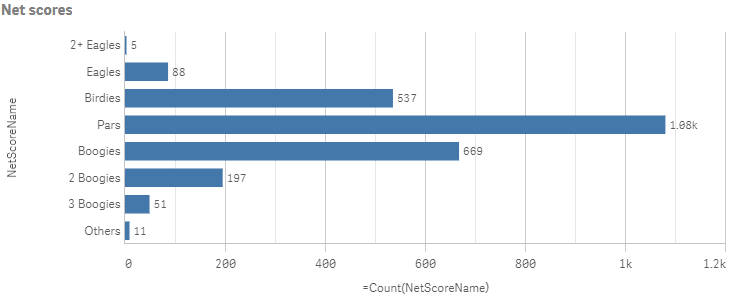
In this example we want to sort the dimension values based on its numerical representation (NetScoreDiff).
1. Sorting
Sorting is set on the dimension in the columns by disabling auto sort and defining the qSortCriterias object.
Disable automatic sorting by setting "autoSort": false. In the qSortCriterias object, enable sort by expression and then define the expression, which in this case is the field NetScoreDiff: { "qSortByExpression": 1, "qExpression": { "qv": "NetScoreDiff" } }.
{ "qDef": { "qFieldDefs": [ "NetScoreName" ], "qSortCriterias": [ { "qSortByExpression": 1, "qExpression": { "qv": "NetScoreDiff" } } ], "autoSort": false } }
2. Horizontal orientation
If you also want to change the way the bar chart is presented by changing to horizontal orientation, adding narrow grid line spacing and also showing the value labels. All these changes are done in the options.
Start by changing to horizontal orientation: "orientation": "horizontal".
/\*Horizontal orientation\*/ "orientation": "horizontal"
3. Grid line spacing
Grid line spacing is changed in the gridLine object. Disable automatic grid line spacing ("auto": false) and then define the custom spacing.
Set "spacing": 3 since we want narrow grid line spacing.
/\*Horizontal orientation\*/ "orientation": "horizontal", /\*Narrow grid line spacing\*/ "gridLine": { "auto": false, "spacing": 3 }
4. Data points
Value labels are displayed by setting "showLabels": true in the dataPoint object.
/\*Horizontal orientation\*/ "orientation": "horizontal", /\*Narrow grid line spacing\*/ "gridLine": { "auto": false, "spacing": 3 }, /\*show value labels\*/ "dataPoint": { "showLabels": true }
### Result
### Code examples
[](https://help.qlik.com/en-US/sense-developer/Subsystems/Mashups/Content/Sense_Mashups/Create/Visualizations/Barchart/create-barchart.htm)
#### Visualization API
```
app.visualization.create(
'barchart',
[
{
"qDef": {
"qFieldDefs": [
"NetScoreName"
],
"qSortCriterias": [
{
"qSortByExpression": 1,
"qExpression": {
"qv": "NetScoreDiff"
}
}
],
"autoSort": false
}
},
"=Count(NetScoreName)"
],
{
"showTitles": true,
"title": "Net scores",
"orientation": "horizontal",
"gridLine": {
"auto": false,
"spacing": 3
},
"dataPoint": {
"showLabels": true
}
}
).then(function(vis){
vis.show("QV01");
});
```
[](https://help.qlik.com/en-US/sense-developer/Subsystems/Mashups/Content/Sense_Mashups/Create/Visualizations/Barchart/create-barchart.htm)
#### qlik-visual
```
```
## Color and legend settings
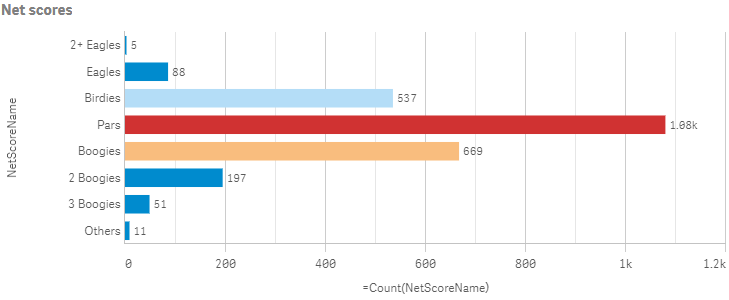
In this example we want to color the bar chart by the measure and hide the color legend.
1. Color by measure
Coloring is defined in the color object. Custom coloring is done by setting "auto": false. When auto-colors are switched off, you must set a mode to color by.
If you want to color the bar chart by measure, set "mode": "byMeasure". Then define the byMeasureDef property.
/\*Color by measure\*/ "color": { "auto": false, "mode": "byMeasure", "measureScheme": "dc", "reverseScheme": false, "autoMinMax": true, "byMeasureDef": { "label": "Count(NetScoreName)", "key": "Count(NetScoreName)", "type": "expression" } }
2. Hide color legend
In this example we do not want to show the legend, so it is switched off in the legend object by setting "show": false.
/\*Color by measure\*/ "color": { "auto": false, "mode": "byMeasure", "measureScheme": "dc", "reverseScheme": false, "autoMinMax": true, "byMeasureDef": { "label": "Count(NetScoreName)", "key": "Count(NetScoreName)", "type": "expression" } }, /\*Do not show color legend\*/ "legend": { "show": false }
### Result
### Code examples
[](https://help.qlik.com/en-US/sense-developer/Subsystems/Mashups/Content/Sense_Mashups/Create/Visualizations/Barchart/create-barchart.htm)
#### Visualization API
```
app.visualization.create(
'barchart',
[
{
"qDef": {
"qFieldDefs": [
"NetScoreName"
],
"qSortCriterias": [
{
"qSortByExpression": 1,
"qExpression": {
"qv": "NetScoreDiff"
}
}
],
"autoSort": false
}
},
"=Count(NetScoreName)"
],
{
"showTitles": true,
"title": "Net scores",
"orientation": "horizontal",
"gridLine": {
"auto": false,
"spacing": 3
},
"dataPoint": {
"showLabels": true
},
"color": {
"auto": false,
"mode": "byMeasure",
"measureScheme": "dc",
"reverseScheme": false,
"autoMinMax": true,
"byMeasureDef": {
"label": "Count(NetScoreName)",
"key": "Count(NetScoreName)",
"type": "expression"
}
},
"legend": {
"show": false
}
}
).then(function(vis){
vis.show("QV01");
});
```
[](https://help.qlik.com/en-US/sense-developer/Subsystems/Mashups/Content/Sense_Mashups/Create/Visualizations/Barchart/create-barchart.htm)
#### qlik-visual
```
```
## Dimension and measure axis settings
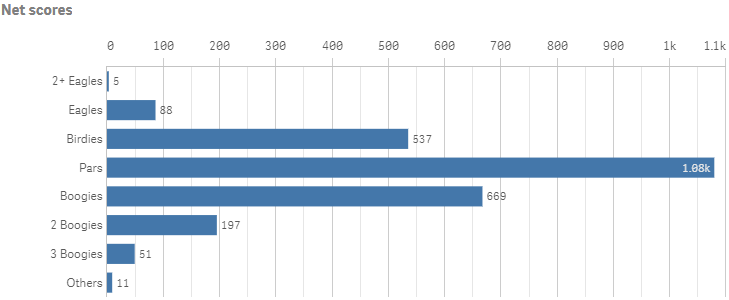
In this example we want to do some changes to how the dimension axis and the measure axis are presented.
Tip noteThis example is a continuation of the [Sorting and presentation settings](https://help.qlik.com/en-US/sense-developer/November2025/Subsystems/Mashups/Content/Sense_Mashups/Create/Visualizations/Barchart/create-barchart.htm#Sorting) example.
1. Dimension axis
Dimension axis settings are set in the dimensionAxis object. Placement in the visualization is depending on the orientation of the bar chart.
Set to display labels only on the dimension axis: "show": "labels".
/\*Dimension axis: Show labels only\*/ "dimensionAxis": { "show": "labels" }
2. Measure axis
Measure axis settings are set in the measureAxis object. Placement in the visualization is depending on the orientation of the bar chart.
Set to display labels only. Place the position of the axis at the top by setting "dock": "far". A custom range of the measure values can be used by disabling auto-range: "autoMinMax": false and setting the minMax mode. The mode can be either min, max or minMax. In this example, we select to use max and therefore need to set the maximum value.
/\*Dimension axis: Show labels only\*/ "dimensionAxis": { "show": "labels" }, /\*Measure axis: Show labels only, axis on top, narrow scale, Custom range: max 1100\*/ "measureAxis": { "show": "labels", "dock": "far", "spacing": 0.5, "autoMinMax": false, "minMax": "max", "max": 1100 }
### Result
### Code examples
[](https://help.qlik.com/en-US/sense-developer/Subsystems/Mashups/Content/Sense_Mashups/Create/Visualizations/Barchart/create-barchart.htm)
#### Visualization API
```
app.visualization.create(
'barchart',
[
{
"qDef": {
"qFieldDefs": [
"NetScoreName"
],
"qSortCriterias": [
{
"qSortByExpression": 1,
"qExpression": {
"qv": "NetScoreDiff"
}
}
],
"autoSort": false
}
},
"=Count(NetScoreName)"
],
{
"showTitles": true,
"title": "Net scores",
"orientation": "horizontal",
"gridLine": {
"auto": false,
"spacing": 3
},
"dataPoint": {
"showLabels": true
},
"dimensionAxis": {
"show": "labels"
},
"measureAxis": {
"show": "labels",
"dock": "far",
"spacing": 0.5,
"autoMinMax": false,
"minMax": "max",
"max": 1100
}
}
).then(function(vis){
vis.show("QV01");
});
```
[](https://help.qlik.com/en-US/sense-developer/Subsystems/Mashups/Content/Sense_Mashups/Create/Visualizations/Barchart/create-barchart.htm)
#### qlik-visual
```
```
## Using reference lines
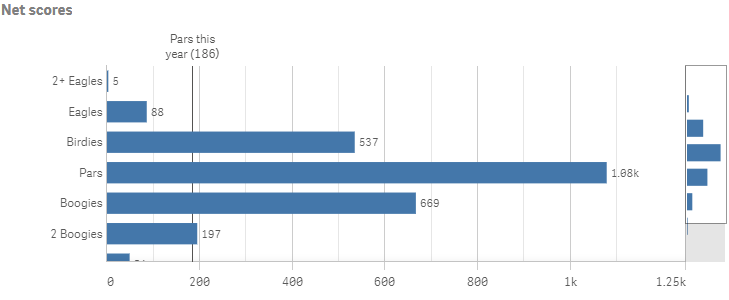
In this example we add a reference line to the bar chart.
Tip noteFor more information, see [Reference lines](https://help.qlik.com/en-US/sense-developer/November2025/Subsystems/Mashups/Content/Sense_Mashups/Create/Visualizations/reference-lines.htm)
1. RefLine object
Reference lines are defined in the refLine object. You can have several reference lines defined for the same visualization. The properties of the reference line are set in an array (refLines) .
This example depicts a reference line based on a value expression.
"refLine": { "refLines": [ { "show": true, "label": "Pars this year", "paletteColor": { "index": 14, "color": "#545352" }, "refLineExpr": { "value": { "qValueExpression": { "qExpr": "=Count({<[Date.autoCalendar.YearsAgo]={'0'},NetScoreName={'Pars'}>}NetScoreName)" } }, "label": { "qStringExpression": { "qExpr": "=Count({<[Date.autoCalendar.YearsAgo]={'0'},NetScoreName={'Pars'}>}NetScoreName)" } } }, "cId": "FVFpQm" } ] }
### Result
### Code examples
[](https://help.qlik.com/en-US/sense-developer/Subsystems/Mashups/Content/Sense_Mashups/Create/Visualizations/Barchart/create-barchart.htm)
#### Visualization API
```
app.visualization.create(
'barchart',
[
{
"qDef": {
"qFieldDefs": [
"NetScoreName"
],
"qSortCriterias": [
{
"qSortByExpression": 1,
"qExpression": {
"qv": "NetScoreDiff"
}
}
],
"autoSort": false
}
},
"=Count(NetScoreName)"
],
{
"refLine": {
"refLines": [
{
"show": true,
"label": "Pars this year",
"paletteColor": {
"index": 14,
"color": "#545352"
},
"refLineExpr": {
"value": {
"qValueExpression": {
"qExpr": "=Count({<[Date.autoCalendar.YearsAgo]={'0'},NetScoreName={'Pars'}>}NetScoreName)"
}
},
"label": {
"qStringExpression": {
"qExpr": "=Count({<[Date.autoCalendar.YearsAgo]={'0'},NetScoreName={'Pars'}>}NetScoreName)"
}
}
},
"cId": "FVFpQm"
}
]
},
"showTitles": true,
"title": "Net scores",
"orientation": "horizontal",
"gridLine": {
"auto": false,
"spacing": 3
},
"dataPoint": {
"showLabels": true
},
"dimensionAxis": {
"show": "labels"
},
"measureAxis": {
"show": "labels",
"dock": "near",
"spacing": 0.5,
"autoMinMax": false,
"minMax": "max",
"max": 1250
}
}
).then(function(vis){
vis.show("QV01");
});
```
[](https://help.qlik.com/en-US/sense-developer/Subsystems/Mashups/Content/Sense_Mashups/Create/Visualizations/Barchart/create-barchart.htm)
#### qlik-visual
```
```
## Grouped and stacked bar charts
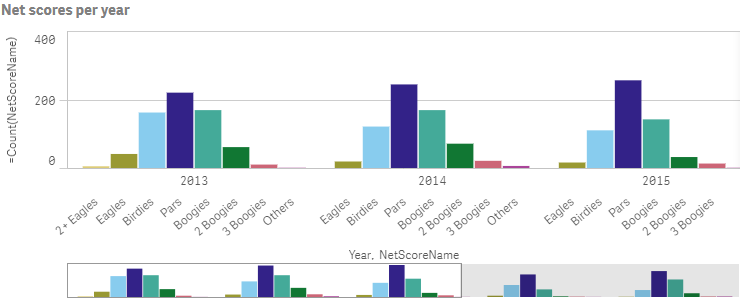
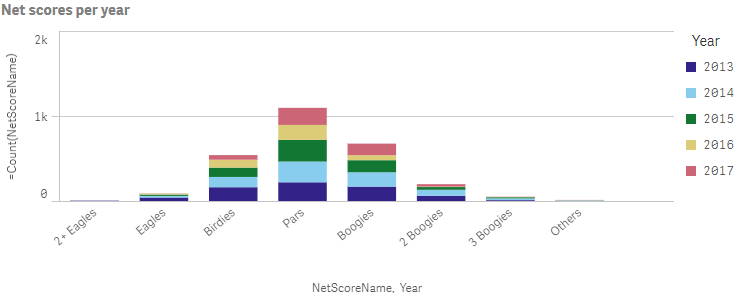
You can make more complex comparisons of data by using grouped or stacked bars. This requires using two dimensions and one measure. The two example charts use the same two dimensions and the same measure.
1. Grouped bar chart
With grouped bars, you can easily compare two or more items in the same categorical group. Grouped bars are defined in the barGrouping object.
"barGrouping": { "grouping": "grouped" }
Result
2. Stacked bar chart
With stacked bars it is easier to compare the total quantity between different periods. Stacked bars combine bars of different groups on top of each other and the total height of the resulting bar represents the combined result.
When creating stacked bar charts, we must define the way the data is handled internally by the engine. This is done in the qMode property inside the qHyperCubeDef.
"qHyperCubeDef": { "qMode": "K" }
Stacked bars are then defined in the barGrouping object.
"barGrouping": { "grouping": "stacked" }
Result
### Code examples: Grouped bar chart
[](https://help.qlik.com/en-US/sense-developer/Subsystems/Mashups/Content/Sense_Mashups/Create/Visualizations/Barchart/create-barchart.htm)
#### Visualization API
```
```
```
app.visualization.create(
'barchart',
[
{
"qDef": {
"qFieldDefs": [
"Date.autoCalendar.Year"
],
"qFieldLabels": [
"Year"
]
}
},
{
"qDef": {
"qFieldDefs": [
"NetScoreName"
],
"qSortCriterias": [
{
"qSortByExpression": 1,
"qExpression": {
"qv": "NetScoreDiff"
}
}
],
"autoSort": false
}
},
"=Count(NetScoreName)"
],
{
"showTitles": true,
"title": "Net scores per year",
"showDetails": false,
"barGrouping": {
"grouping": "grouped"
},
"legend": {
"show": false
}
}
).then(function(vis){
vis.show("QV01");
});
```
[](https://help.qlik.com/en-US/sense-developer/Subsystems/Mashups/Content/Sense_Mashups/Create/Visualizations/Barchart/create-barchart.htm)
#### qlik-visual
```
```
### Code examples: Stacked bar chart
[](https://help.qlik.com/en-US/sense-developer/Subsystems/Mashups/Content/Sense_Mashups/Create/Visualizations/Barchart/create-barchart.htm)
#### Visualization API
```
app.visualization.create(
'barchart',
[
{
"qDef": {
"qFieldDefs": [
"NetScoreName"
],
"qSortCriterias": [
{
"qSortByExpression": 1,
"qExpression": {
"qv": "NetScoreDiff"
}
}
],
"autoSort": false
}
},
{
"qDef": {
"qFieldDefs": [
"Date.autoCalendar.Year"
],
"qFieldLabels": [
"Year"
]
}
},
"=Count(NetScoreName)"
],
{
"showTitles": true,
"title": "Net scores per year",
"showDetails": false,
"qHyperCubeDef": {
"qMode": "K"
},
"barGrouping": {
"grouping": "stacked"
}
}
).then(function(vis){
vis.show("QV01");
});
```
[](https://help.qlik.com/en-US/sense-developer/Subsystems/Mashups/Content/Sense_Mashups/Create/Visualizations/Barchart/create-barchart.htm)
#### qlik-visual
```
```