# Accessibility in mashups

Qlik Sense provides a function for accessibility features to help users interact with Qlik Sense.

## Viewing data of visualizations

You can change between a visualization and a view of the data it represents.

When working with a visualization in analysis mode, you might need to take a look at the data behind a selection. For most visualizations, a table containing their data is available when the [Qvisualization.toggleDataView()](https://help.qlik.com/en-US/sense-developer/May2025/Subsystems/APIs/Content/Sense_ClientAPIs/CapabilityAPIs/VisualizationAPI/toggleDataView-method.htm) method is defined.

### Visualizations where data viewing is available

In the following visualizations you can change between the visualization and a view of its data in table form:

* Bar chart
* Box plot (with one or more dimensions)
* Combo chart
* Distribution plot
* Histogram
* Line chart
* Pie chart
* Pivot table
* Scatter plot
* Treemap

### toggleDataView() implementation

The code example below defines the toggleDataView() function for two visualizations.

```
function toggle(vis, element) {
  vis.toggleDataView().then(function (toggled) {
    vis.isToggled = toggled;
    document.getElementById(element).parentElement.focus();
  });
}

document.getElementById("toggle1").addEventListener("click", function () {
  toggle(vis1, "QV01");
});
document.getElementById("toggle2").addEventListener("click", function () {
  toggle(vis2, "QV02");
});
document.getElementById("clear").addEventListener("click", function () {
  app.clearAll();
});
```

## Accessible mashup example

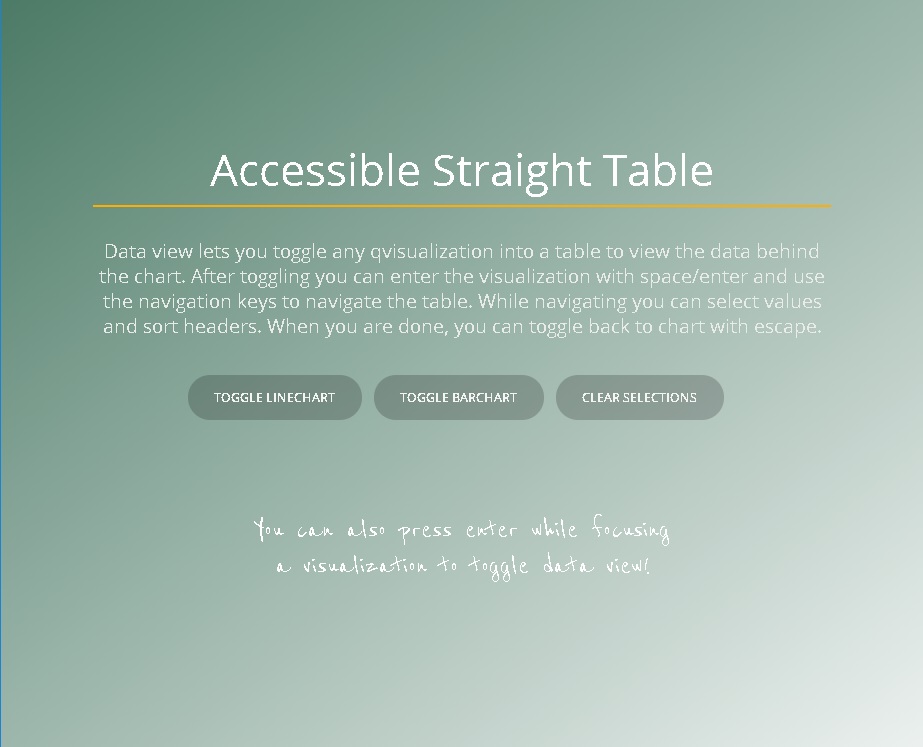
Data view lets you toggle any QVisualization into a table to view the data behind the chart. After toggling, you can enter the visualization with SPACE or ENTER and use the navigation keys to navigate the table. While navigating, you can select values and sort headers. When you are done, you can toggle back to the chart with ESC.

To run this example, download the [Helpdesk Management](https://help.qlik.com/en-US/sense/May2025/tutorials/HelpdeskManagement.zip) app and import it into Qlik Sense using the QMC.
![Accessible straight table example](https://help.qlik.com/en-US/sense-developer/May2025/Subsystems/Mashups/Content/Resources/Images/mashup-example-accessible-straight-table2.jpg)

### Source code

[](https://help.qlik.com/en-US/sense-developer/Subsystems/Mashups/Content/Sense_Mashups/Howtos/mashups-accessibility.htm)

#### accessible-straight-table-mashup.html

```
<!doctype html>
<html lang="en"><head>
    <meta http-equiv="X-UA-Compatible" content="IE=edge,chrome=1">
    <title>Qlik Sense: Mashup</title>
    <meta charset="utf-8">
    <meta http-equiv="content-type" content="text/html; charset=UTF-8">
    <meta name="HandheldFriendly" content="True">
    <meta name="MobileOptimized" content="320">
    <meta name="viewport" content="width=device-width">
    <meta name="apple-mobile-web-app-capable" content="yes">
    <meta name="apple-mobile-web-app-status-bar-style" content="black">
    <meta http-equiv="cleartype" content="on">
    <link href="https://fonts.googleapis.com/css?family=Open+Sans|Reenie+Beanie" rel="stylesheet">
    <link rel="stylesheet" href="../../resources/autogenerated/qlik-styles.css">
    <script src="../../resources/assets/external/requirejs/require.js"></script>
    <script src="accessible-straight-table-mashup.js"></script>
    
</head>
    <body role="application">
        <div class="content">
            <div class="section info">
                <div class="image">
                    <div class="overlay">
                        <div class="textWrapper">
                            <h1 class="header">Accessible Straight Table</h1>
                            <div class="divider"></div>
                            <div class="description-text"> Data view lets you toggle any qvisualization into a table to view the data behind the chart. After toggling you can enter the visualization with space/enter and use the navigation keys to navigate the table. While navigating you can select values and sort headers. When you are done, you can toggle back to chart with escape.</div>
                            <div class="buttons-container">
                                <button class="rounded-button" id="toggle1">Toggle linechart</button>
                                <button class="rounded-button" id="toggle2">Toggle barchart</button>
                                <button class="rounded-button" id="clear">Clear selections</button>
                            </div>
                        </div>
                        <div class="hint">
                            <p>You can also press enter while focusing<br> a visualization to toggle data view!</p>
                        </div>
                    </div>
                </div>
            </div>
            <div class="section">
                <div class="visualizations-wrapper">
                    <div id="linechart" tabindex="0" class="chart-padding-container" aria-label="Linechart">
                        <div id="QV01" class="object"></div>
                    </div>
                    <div id="barchart" tabindex="0" class="chart-padding-container" aria-label="Barchart">
                        <div id="QV02" class="object"></div>
                    </div>
                </div>
            </div>
        </div>
    </body>

    <style>
        body, html {
            font-family: 'Open Sans', sans-serif;
            width: 100%;
            height: 100%;
            overflow-y: hidden;
            overflow-x: hidden;
        }
        .content{
            height: 100%;
            width: 100%;
            display: flex;
            overflow-y: hidden;
            overflow-x: hidden;
        }
        .section {
            flex: 1 0 auto;
            height: 100%;
            width: 50%;
        }
        .hint {
            display: flex;
            font-family: 'Reenie Beanie', cursive;
            bottom: 10%;
            right: 5%;
            color:white;
            font-size: 30px;
            text-align: center;
        }
        .hint img {
            align-self: center;
            transform: translate(-10px, -5px) rotateX(180deg);
        }
        .section.info {
            position: relative;
            box-shadow: 0px 0px 40px 0px rgba(0,0,0,0.55);
        }
        .visualizations-wrapper {
            width: 100%;
            height: 100%;
            display: flex;
            justify-content: center;
            align-items: center;
            background: linear-gradient(135deg, rgba(0,0,0,0.05) 0%, rgba(75,122,102,0.5) 100%);
            flex-direction: column;
        }
        .chart-padding-container { 
            height: calc(50% - 125px);
            width: calc(100% - 250px);
            border: 1px rgba(75,122,102,0.4) solid;
            background-color: rgba(255,255,255, 0.8);
            box-shadow: 0px 0px 20px 0px rgba(0,0,0,0.20);
            border-radius: 2px;
            padding: 30px;
            margin: 20px;
        }
        .object {
            position: relative;
            width:100%;
            height:100%;
            min-height: 100%;
            min-width: 100%;
        }
        .chart-padding-container:focus {
            outline: 2px rgb(255, 174, 0) solid;
            outline-offset: -1px;
        }
        .header {
            font-size: 40px;
            color: white;
            text-align: center;
            font-weight: 500;
        }
        .divider {
            width: 100%;
            height: 1px;
            min-height: 1px;
            margin: 5px 0 25px;
            background-color: rgb(255, 174, 0);
        }
        .description-text {
            font-size: 18px;
            margin-bottom: 20px;
            color:rgb(234, 236, 234);
            font-weight: 100;
            text-align: center;
            width:100%;
        }
        .buttons-container {
            display: flex;
            align-items: center;
            justify-content: center;
            flex-wrap: wrap;
        }
        .rounded-button {
            flex: 0 0 auto;
            font: inherit;
            cursor: pointer;
            outline: inherit;
            text-transform: uppercase;
            font-weight: bold;
            padding: 10px 20px;
            border-radius: 30px;
            background-color: rgba(0,0,0,0.2);
            margin-top: 10px;
            margin-right: 10px;
            border: 1px transparent solid;
            font-size: 12px;
            color: whitesmoke;
            transition: background-color 0.2s;
        }
        .rounded-button:hover {
            background-color: rgba(0,0,0,0.35);
        }
        .rounded-button:focus {
            border: 1px rgb(255, 174, 0) solid;
            box-shadow: 0px 0px 20px -4px rgba(255, 174, 0);
        }
        .textWrapper {
            width: 80%;
            height: 50%;
            margin-top: 40px;
            display: flex;
            flex-direction: column;
            justify-content: center;
            align-items: center;
        }
        .image {
            width: 100%;
            height: 100%;
            background-position: bottom;
            background-size: cover;
        }
        .overlay {
            width: 100%;
            height: 100%;
            display: flex;
            flex-direction: column;
            align-items: center;
            background: linear-gradient(142deg, rgba(75,122,102,1) 0%,rgba(0,0,0,0) 100%);
        }
        .qv-st-data-cell-null-value {
            background-color: transparent;
        }
        .qv-st-data-cell:focus, .qv-st-header-cell:focus {
            outline: 2px rgb(255, 174, 0) solid;
        }
        .qv-st-data-cell, .qv-st-header-cell {
            overflow: visible;
        }
        .qv-selection-toolbar {
            background: linear-gradient(135deg, rgb(255,255,255) 0%, rgb(241, 241, 241) 100%);
        }

        @media only screen and (max-width: 1200px) {
            body, html {
                height: 100%;
            }
            .content{ 
                flex-direction: column;
                overflow-y: auto;
            }
            .section {
                width: 100%;
                height: 1000px;
            }
            .section.info {
                height: 800px;
            }
            .hint {
                bottom: 20%;
                left: 5%;
                right:auto;
                transform: rotate(25deg);
            }
            .hint img {
                transform: translate(-10px, 5px);
            }
        }
         @media only screen and (max-width: 650px), only screen and (max-height: 800px) and (min-width: 1200px){
            .qvobject {
                height: calc(50% - 125px);
                margin: 15px;
            }
             .description-text {
                font-size: 15px;
            }
            .header {
                font-size: 35px;
            }
            .rounded-button { 
                font-size: 10px;
            }
            .hint {
                bottom: calc(10% + 30px);
                font-size: 25px;
            }
         }
    </style>
</html>
```

[](https://help.qlik.com/en-US/sense-developer/Subsystems/Mashups/Content/Sense_Mashups/Howtos/mashups-accessibility.htm)

#### accessible-straight-table-mashup.js

```
/*
 * Accessible Straight Table Demo Mashup
 * @qlik
 *
*/
var prefix = window.location.pathname.substr(0, window.location.pathname.toLowerCase().lastIndexOf("/extensions") + 1);
var config = {
	host: window.location.hostname,
	prefix: prefix,
	port: window.location.port,
	isSecure: window.location.protocol === "https:"
};
require.config({
	baseUrl: (config.isSecure ? "https://" : "http://") + config.host + (config.port ? ":" + config.port : "") + config.prefix + "resources"
});

require(["js/qlik"], function (qlik) {
	var global = qlik.getGlobal(config);
	
	global.on("closed", function () {});

	global.on("error", function ( error ) {
		alert(error.message);
	});

	qlik.getAppList(function (list) {
		// Find the correct app
		var appIds = list.filter(function (obj) {
			return obj.qDocName.indexOf('Helpdesk') !== -1; // Helpdesk Management.qvf
		}).map(function (obj) {
			return obj.qDocId;
		});
		// Open app
		var app = qlik.openApp(appIds[0], config);

		app.on("error", function ( error ) {
			alert(error.message);
		});

		//Create visualizations
		var vis1, vis2;
		app.visualization.create(
			'linechart',
			["Case Owner",
				{
					"qLibraryId": "eqZjE",
					"qType": "measure"
				},
				{
					"qLibraryId": "MPcQeZ",
					"qType": "measure"
				}
			],
			{	"title" : "Linechart",
				"navigation": false,
				"dataPoint": { "bubbleSizes": 8 },
				"labels": { "mode": 1 },
				"color": {
					"auto": false,
					"mode": "primary",
					"useBaseColors": "off",
					"paletteColor": {
						"index": -1,
						"color": "#E5A000"
					}
				}
			}
		).then(function (vis) {
			vis1 = vis;
			vis.show("QV01");
		});

		app.visualization.create(
			'barchart',
			["Case Owner Group", "=Avg([Case Duration Time])"],
			{
				"title" : "Barchart",
				"orientation": "horizontal",
				"dataPoint": { "showLabels": true },
				"gridLine": { "auto": false, "spacing": 3 },
				"color": {
					"auto": false,
					"mode": "primary",
					"useBaseColors": "off",
					"paletteColor": {
						"index": -1,
						"color": "#E5A000"
					}
				}
			}
		).then(function (vis) {
			vis2 = vis;
			vis.show("QV02");
		});

		function toggle(vis, element) {
			vis.toggleDataView().then(function (toggled) {
				vis.isToggled = toggled;
				document.getElementById(element).parentElement.focus();
			});
		}

		function handleKeydown(event, vis, element) {
			var visualization = document.getElementById(element);
			if (event.which === 32 || event.which === 13) { // Space, Enter
				if (vis.isToggled) {
				visualization.querySelector('.qv-st td').focus();
				}else {
					toggle(vis, element);
				}
			} else if (event.which === 27 && vis.isToggled && visualization.querySelector(".qv-selection-toolbar") === null) { // Esc
				toggle(vis, element);
			}
		}

		document.getElementById("toggle1").addEventListener("click", function () {
			toggle(vis1, "QV01");
		});
		document.getElementById("toggle2").addEventListener("click", function () {
			toggle(vis2, "QV02");
		});
		document.getElementById("clear").addEventListener("click", function () {
			app.clearAll();
		});
		document.getElementById("linechart").addEventListener("keydown", function (event) {
			handleKeydown(event, vis1, "QV01");
		});
		document.getElementById("barchart").addEventListener("keydown", function (event) {
			handleKeydown(event, vis2, "QV02");
		});

	}, config);
});
```

[](https://help.qlik.com/en-US/sense-developer/Subsystems/Mashups/Content/Sense_Mashups/Howtos/mashups-accessibility.htm)

#### accessible-straight-table-mashup.qext

```
{
	"type": "mashup",
	"name": "accessible-straight-table-mashup",
	"description": "Mashup demoing accessible straight table and data view",
	"author": "Qlik",
	"keywords": "qlik-sense, visualization, mashup, accessibility",
	"dependencies": {
		"qlik-sense": ">=1.0.x"
	}
}
```