Time-aware charts ON THIS PAGE Time-aware charts are visualizations that use a continuous scale to provide a complete and accurate view of time-based data. That is, when you enable continuous scaling on the x-axis in a chart with date fields, data points are separated from each other by a distance relative to their associated time. As well, the axis labels are evenly separated whether or not there is data for that point and the chart view is compressed to avoid scrolling.
A continuous scale is most commonly used with date fields such as:
Second
Minute
Hour
Week
Month
YearMonth
Quarter
YearQuarter
Year
Date
Timestamp
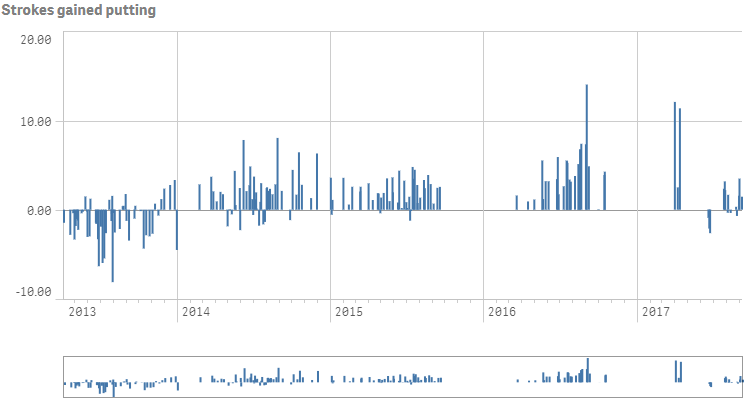
Time-aware bar charts
Create a time-aware bar chart, containing one dimension and one measure. The visualization type is barchart .
Define the dimension and the measure as columns. Note the number formatting applied to the measure.
{
"qDef": {
"qFieldDefs": [
"Date.autoCalendar.Date"
],
"qFieldLabels": [
"Date"
]
}
},
{
"qDef": {
"qLabel": "Strokes gained putting",
"qDef": "Sum(ExpPutts-Putts)",
"qNumFormat": {
"qType": "F",
"qnDec": 2,
"qUseThou": 0,
"qFmt": "#,##0.00",
"qDec": ".",
"qThou": ","
}
}
}
Define a title in the options: "title": "Strokes gained putting" . In the dimensionAxis object, set "continuousAuto": false . Then set "preferContinuousAxis": true .
{
"showTitles": true,
"title": "Strokes gained putting",
"dimensionAxis": {
"continuousAuto": false,
"show": "labels"
},
"preferContinuousAxis": true,
"measureAxis": {
"show": "labels"
}
}
Result
Code examples
Visualization API
app.visualization.create(
  'barchart',
  [
    {
      "qDef": {
        "qFieldDefs": [
          "Date.autoCalendar.Date"
        ],
        "qFieldLabels": [
          "Date"
        ]
      }
    },
    {
      "qDef": {
        "qLabel": "Strokes gained putting",
        "qDef": "Sum(ExpPutts-Putts)",
        "qNumFormat": {
          "qType": "F",
          "qnDec": 2,
          "qUseThou": 0,
          "qFmt": "#,##0.00",
          "qDec": ".",
          "qThou": ","
        }
      }
    }
  ],
  {
    "showTitles": true,
    "title": "Strokes gained putting",
    "dimensionAxis": {
      "continuousAuto": false,
      "show": "labels"
    },
    "preferContinuousAxis": true,
    "measureAxis": {
      "show": "labels"
    }
  }
).then(function(vis){
  vis.show("QV01");
});
qlik-visual
<qlik-visual appid="Tutorial-Golf.qvf"
type="barchart"
cols='[
{
"qDef": {
"qFieldDefs": [
"Date.autoCalendar.Date"
],
"qFieldLabels": [
"Date"
]
}
},
{
"qDef": {
"qLabel": "Strokes gained putting",
"qDef": "Sum(ExpPutts-Putts)",
"qNumFormat": {
"qType": "F",
"qnDec": 2,
"qUseThou": 0,
"qFmt": "#,##0.00",
"qDec": ".",
"qThou": ","
}
}
}
]'
options='{
"showTitles": true,
"title": "Strokes gained putting",
"dimensionAxis": {
"continuousAuto": false,
"show": "labels"
},
"preferContinuousAxis": true,
"measureAxis": {
"show": "labels"
}
}' >
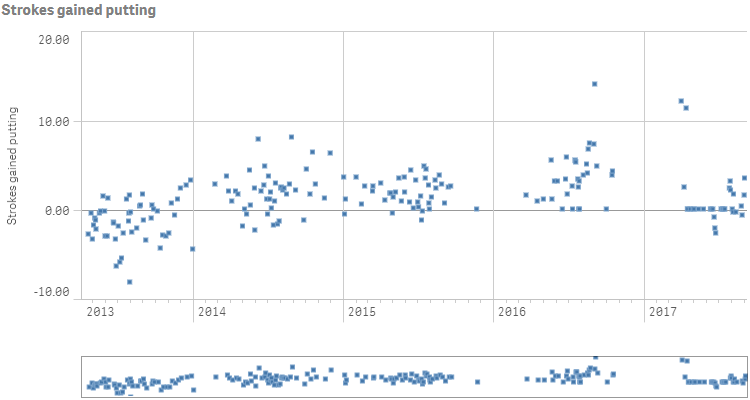
</qlik-visual> Time-aware combo charts
Create a time-aware combo chart, containing one dimension and one measure. The visualization type is combochart .
Define the dimension and the measure as columns. In this example we want to display the measure as a marker on the primary axis: "series": {
"type": "marker",
"axis": 0, . The marker type is a filled square: "marker": "rect",
"markerFill": true
} .
Also note the number formatting applied to the measure.
{
"qDef": {
"qFieldDefs": [
"Date.autoCalendar.Date"
],
"qFieldLabels": [
"Date"
]
}
},
{
"qDef": {
"qLabel": "Strokes gained putting",
"qDef": "Sum(ExpPutts-Putts)",
"qNumFormat": {
"qType": "F",
"qnDec": 2,
"qUseThou": 0,
"qFmt": "#,##0.00",
"qDec": ".",
"qThou": ","
},
"series": {
"type": "marker",
"axis": 0,
"marker": "rect",
"markerFill": true
}
}
}
Define a title in the options: "title": "Strokes gained putting" . In the dimensionAxis object, set "continuousAuto": false . Then set "preferContinuousAxis": true .
{
"showTitles": true,
"title": "Strokes gained putting",
"dimensionAxis": {
"continuousAuto": false,
"show": "labels"
},
"preferContinuousAxis": true,
"measureAxis": {
"show": "labels"
}
}
Result
Code examples
Visualization API
app.visualization.create(
  'combochart',
  [
    {
      "qDef": {
        "qFieldDefs": [
          "Date.autoCalendar.Date"
        ],
        "qFieldLabels": [
          "Date"
        ]
      }
    },
    {
      "qDef": {
        "qLabel": "Strokes gained putting",
        "qDef": "Sum(ExpPutts-Putts)",
        "qNumFormat": {
          "qType": "F",
          "qnDec": 2,
          "qUseThou": 0,
          "qFmt": "#,##0.00",
          "qDec": ".",
          "qThou": ","
        },
        "series": {
          "type": "marker",
          "axis": 0,
          "marker": "rect",
          "markerFill": true
        }
      }
    }
  ],
  {
    "showTitles": true,
    "title": "Strokes gained putting",
    "dimensionAxis": {
      "continuousAuto": false,
      "show": "labels"
    },
    "preferContinuousAxis": true,
    "measureAxes": [
      {
        "show": "labels"
      },
      {
        "show": "all"
      }
    ]
  }
).then(function(vis){
  vis.show("QV01");
});
qlik-visual
<qlik-visual appid="Tutorial-Golf.qvf"
type="combochart"
cols='[
{
"qDef": {
"qFieldDefs": [
"Date.autoCalendar.Date"
],
"qFieldLabels": [
"Date"
]
}
},
{
"qDef": {
"qLabel": "Strokes gained putting",
"qDef": "Sum(ExpPutts-Putts)",
"qNumFormat": {
"qType": "F",
"qnDec": 2,
"qUseThou": 0,
"qFmt": "#,##0.00",
"qDec": ".",
"qThou": ","
},
"series": {
"type": "marker",
"axis": 0,
"marker": "rect",
"markerFill": true
}
}
}
]'
options='{
"showTitles": true,
"title": "Strokes gained putting",
"dimensionAxis": {
"continuousAuto": false,
"show": "labels"
},
"preferContinuousAxis": true,
"measureAxes": [
{
"show": "labels"
},
{
"show": "all"
}
]
}' >
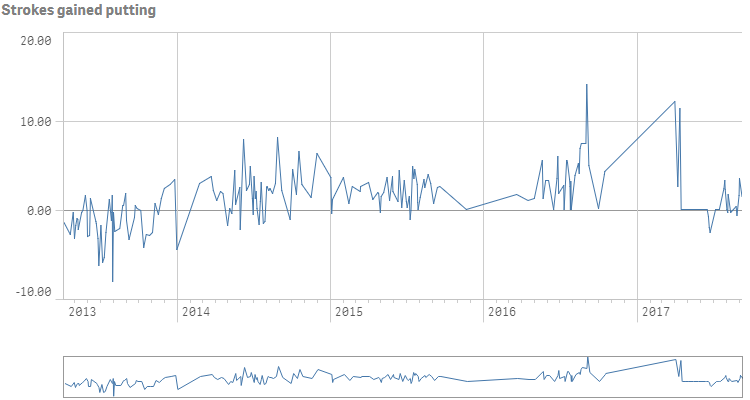
</qlik-visual> Time-aware line charts
Create a time-aware line chart, containing one dimension and one measure. The visualization type is linechart .
Define the dimension and the measure as columns. Note the number formatting applied to the measure.
{
"qDef": {
"qFieldDefs": [
"Date.autoCalendar.Date"
],
"qFieldLabels": [
"Date"
]
}
},
{
"qDef": {
"qLabel": "Strokes gained putting",
"qDef": "Sum(ExpPutts-Putts)",
"qNumFormat": {
"qType": "F",
"qnDec": 2,
"qUseThou": 0,
"qFmt": "#,##0.00",
"qDec": ".",
"qThou": ","
}
}
}
Define a title in the options: "title": "Strokes gained putting" . In the dimensionAxis object, set "continuousAuto": false . Then set "preferContinuousAxis": true .
{
"showTitles": true,
"title": "Strokes gained putting",
"dimensionAxis": {
"continuousAuto": false,
"show": "labels"
},
"preferContinuousAxis": true,
"measureAxis": {
"show": "labels"
}
}
Result
Code examples
Visualization API
app.visualization.create(
  'linechart',
  [
    {
      "qDef": {
        "qFieldDefs": [
          "Date.autoCalendar.Date"
        ],
        "qFieldLabels": [
          "Date"
        ]
      }
    },
    {
      "qDef": {
        "qLabel": "Strokes gained putting",
        "qDef": "Sum(ExpPutts-Putts)",
        "qNumFormat": {
          "qType": "F",
          "qnDec": 2,
          "qUseThou": 0,
          "qFmt": "#,##0.00",
          "qDec": ".",
          "qThou": ","
        }
      }
    }
  ],
  {
    "showTitles": true,
    "title": "Strokes gained putting",
    "dimensionAxis": {
      "continuousAuto": false,
      "show": "labels"
    },
    "preferContinuousAxis": true,
    "measureAxis": {
      "show": "labels"
    }
  }
).then(function(vis){
  vis.show("QV01");
});
qlik-visual
<qlik-visual appid="Tutorial-Golf.qvf"
  type="linechart"
  cols='[
    {
      "qDef": {
        "qFieldDefs": [
          "Date.autoCalendar.Date"
        ],
        "qFieldLabels": [
          "Date"
        ]
      }
    },
    {
      "qDef": {
        "qLabel": "Strokes gained putting",
        "qDef": "Sum(ExpPutts-Putts)",
        "qNumFormat": {
          "qType": "F",
          "qnDec": 2,
          "qUseThou": 0,
          "qFmt": "#,##0.00",
          "qDec": ".",
          "qThou": ","
        }
      }
    }
  ]'
  options='{
    "showTitles": true,
    "title": "Strokes gained putting",
    "dimensionAxis": {
      "continuousAuto": false,
      "show": "labels"
    },
    "preferContinuousAxis": true,
    "measureAxis": {
      "show": "labels"
    }
  }' >
</qlik-visual>