A reference line is a line intersecting the chart area from a given point on the measure axis. You can use a reference line to indicate a certain level of chart data. The reference line is only drawn if it falls within the current range of the measure axis. You can have several reference lines in the same chart. Reference lines are available in the following visualization types:
Bar chart
Box plot
Distribution plot
Gauge
Histogram
Line chart
Scatter plot
Waterfall chart
You can either set the reference line value to an absolute numeric value, or enter an arbitrary numeric expression, see examples below
The refLine object
Reference lines are defined in the refLine object. You can have several reference lines defined for the same visualization.
Example: Empty refLine object
"refLine": {
"refLines": []
}
The properties of the reference line are set in an array (refLines) and can consist of the following properties:
Set to true to display the reference line in the visualization.
Default: false
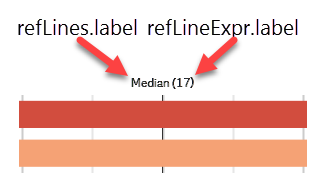
Reference line label as a string.
You can also set a label property inside the refLineExpr object and this defines the label of the value. It follows the following syntax when displayed in the visualization: refLines.label (refLines.refLineExpr.label).
Defines the reference line color. It can either be as an index number from the color palette (0-15) or it can be a HEX color code. If the paletteColor property is not defined, the color defaults to black. If you are using the color property to define a color that is not in the color palette, the index property should be "index": -1.
paletteColor properties
Name
Type
Description
index
Integer
Index in the palette.
The default Qlik Sense color palette:
-1: set to use custom color that is not in the palette.
0: No color
1: White, HEX: #ffffff
2: Light green, HEX: #46c646
3: Green, HEX: #276e27
4: Light blue, HEX: #b6d7ea
5: Blue, HEX: #7db8da
6: Dark blue, HEX: #4477aa
7: Purple, HEX: #8e477d
8: Yellow, HEX: #ffcf02
9: Orange, HEX: #f8981d
10: Red, HEX: #f93f17
11: Brown, HEX: #633d0c
12: Light gray, HEX: #b0afae
13: Gray, HEX: #7b7a78
14: Dark gray, HEX: #545352
15: Black, HEX: #000000
Default: 6
color
String
Color as HEX string.
Mandatory if "index": "-1".
Defines the actual value of the reference line
refLineExpr properties
Name
Type
Description
value
-
Can be an absolute numeric value or an arbitrary numeric expression
Defines the label of the value as a string or as an expression.
You can also set a label property inside the refLines object and this defines the label of the reference line. It follows the following syntax when displayed in the visualization: refLines.label (refLines.refLineExpr.label).
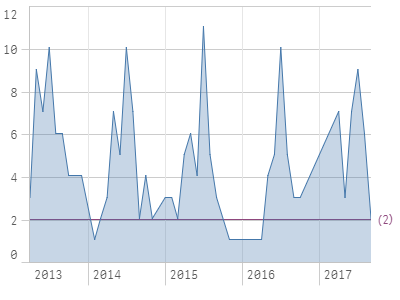
Using an absolute numeric value
This example defines a reference line by an absolute numeric value. Set the absolute numeric value of reference line : "refLineExpr": {
"value": 2,
"label": "2"
}. Then set "show": true to enable the reference line. Define the color of the reference line: "paletteColor": {
"index": 7,
"color": "#8e477d"
}. Note how the label property is empty.
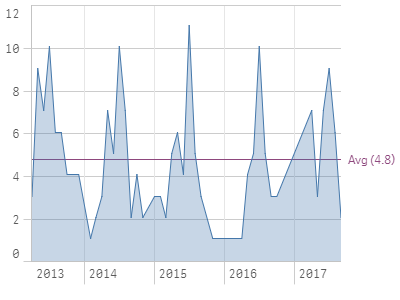
You can use an arbitrary numeric expression as a reference line. This means that the value property includes a value expression instead of a number: "value": {
"qValueExpression": {
"qExpr": "=Count(distinct ID)/Count(distinct [Date.autoCalendar.YearMonth])"
}
}.
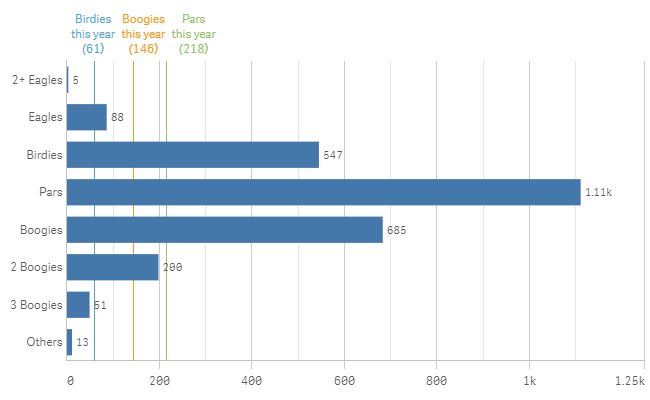
You can use multiple reference lines in your visualization. You can select to keep them in the code but to hide them from being shown in the visualization by setting "show": false, as demonstrated on the last reference line in the example below.