
Monitoring throughput in a Full Load operation
Throughput values for a full-load operation provide information on how fast the table records are being replicated to the target endpoint. The information is displayed in a gauge on the right side of the full-load graph section. The following figure shows the throughput gauge.
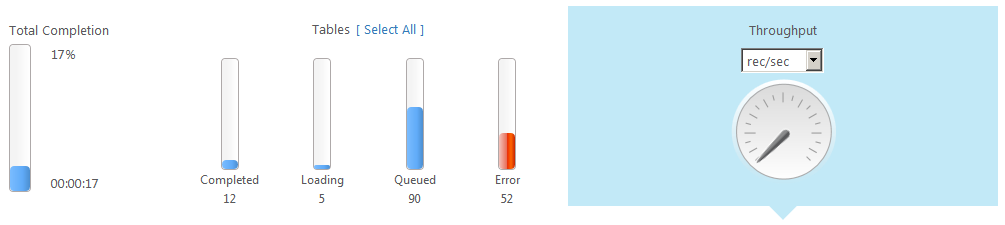
You can set the throughput measurement values either to the number of records replicated per second, or to the number of kilobytes replicated per second. The display is always based on the current load operation.
To set the unit of throughput measurement:
- Select either rec/sec or kbyte/sec from the drop-down menu above the Throughput gauge.
Click the Throughput gauge to display a graph with the target throughput details. To view the graph only, click the expand/collapse arrow on the right of the gray bar above the graph. Click the arrow again to restore the status bars and throughput gauge.