
The Table Viewer dialog is opened when choosing Table Viewer from the File menu or pressing Ctrl+T.
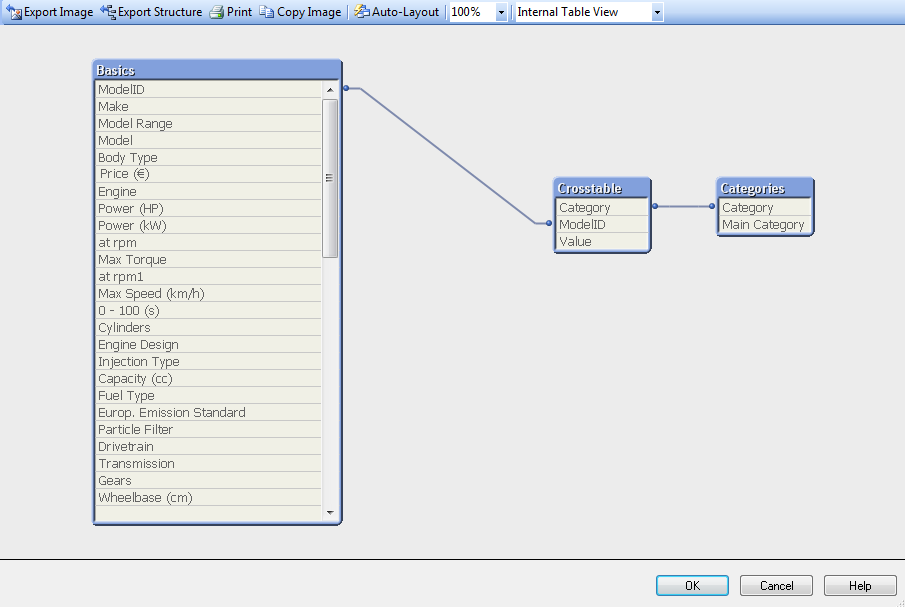
This dialog is used to display the data table structure of the current QlikView document. Tables are shown as boxes with a list of the fields they contain. Connector lines between the boxes show the associations. Where more than two lines meet there are connector points in the form of small dots.
The tables, the connector points and also all points where the connectors bend can be moved by means of mouse drag and drop (see below). When re-arranging the layout like this, the changes will be saved with the document unless the dialog is exited with Cancel.
There are two views available, the layouts of which are stored separately. The two views are:
-
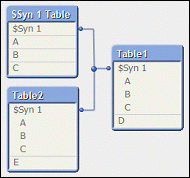
The Internal Table View is the default view. It shows the data tables as QlikView stores them. Composite synthetic keys are formed in tables that share more than one field. Synthetic tables are used to link them. This view offers the best understanding of the QlikView logic and also provides a very clean layout where each pair of tables has a maximum of one connector between them.
-
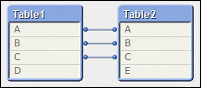
The Source Table View shows data tables as QlikView reads them. Here there are no synthetic fields or synthetic tables. Composite keys are represented by multiple connectors between tables.
When hovering with the cursor above one of the fields in a table, a tool tip pops up with information about the content of this field:
-
Information density is the number of records that have values (i.e. not NULL) in this field as compared to the total number of records in the table.
- Subset ratio is the number of distinct values of this field found in this table as compared to the total number of distinct values of this field (that is other tables as well).
- Table comments are displayed in the tool tip.
- Field comments are displayed in the tool tip.
- Tags that are added in the script or in Document Properties: Tables page, including system tags, are displayed in the tool tip.