
When data that includes circular references is loaded into QlikView, loosely coupled tables are created automatically. This prevents that the circular references create a loop in the internal logic. The loosely coupled tables need to be handled in order to visualize data in a way that is expected and understandable.
Intentionally Creating Loosely Coupled Tables
In some special situations, you might want to disconnect some data from the normal QlikView logic. You can use loosely coupled tables to restrict selections in one field to propagate through to the other fields in the table.
To set a table to be loosely coupled, open the Document Properties dialog and select the Tables tab.
This chapter includes some examples of how loosely coupled tables alter the QlikView logic.
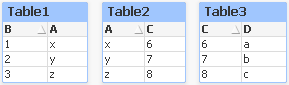
Each of the following three table boxes represents a table read into QlikView:
If the value 2 is selected in field B the following will happen:
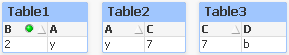
The selection ripples through all tables, and excludes values that are not associated.
Now, let's keep this selection but make Table2 loosely coupled. This means that the logic will be cut between the fields A and C in Table2. The result will look this:
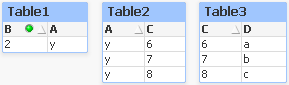
Note that Table2 shown here is a table box and not the table itself. The table box will show all possible combinations between the fields of its columns. Since there is no logic between fields A and C all combinations of their respective possible values are shown.
Example:
The three tables below are found in a rather typical structure: one transaction table and two dimension tables associating to it via one field each.
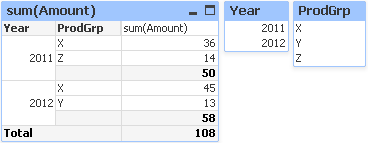
You can visualize sales per year and product group using a pivot table. Next to the pivot table, two list boxes show the dimension fields:
Even though this is a correct pivot table, the effects of QlikView's logic could now potentially lead to undesired results. If the year 2012 is selected, you get the following result:
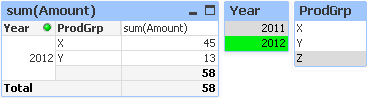
Product group Z is no longer visible in pivot table. This is natural, since the value Z in the field ProdGrp has been excluded by the selection of the value 2012 in the field Year. However, when you analyze sales of year 2012, you probably want to see Z in the chart with a 0 in the sum(Amount) column, so that it is clear to everyone that product group Z exists and that nothing has been sold in 2012.
In some sense, the two fields Year and ProdGrp have nothing to do with each other, and therefore should not interact just because they happen to be associated via the Trans table. This can be dealt with by declaring the Trans table as loosely coupled, which changes the layout of the pivot table:
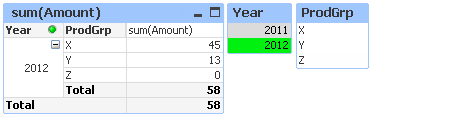
Note that the selection in the Year list box does not render any value in the ProdGrp list box anymore.