Top Function Examples
These examples are made with the top function, but may be applied in a similar manner to the bottom, first and last functions. However, note that the first and last functions are relevant only to pivot tables.
Example 1:
Study the straight table below, depicting the use of the top function in a one-dimensional table:

| Month | sum(Val) | top(sum(Val)) | sum(Val) / top(sum(Val)) |
|---|---|---|---|
| - | 21 | 3 | 700% |
| 1 | 3 | 3 | 100% |
| 2 | 7 | 3 | 233% |
| 3 | 11 | 3 | 367% |
In the single dimension case, the top function will always refer to the first data row of the table ( The total row is not included.)
Note that expressions using the top function will be properly evaluated in the total row too since the total has a clear relation to a specific column segment, in this case the entire column.
Example 2:
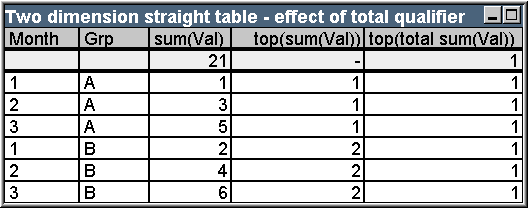
Below is a two-dimensional straight table sorted primarily on the field Grp.
| Month | Grp | sum(Val) | top(sum(Val)) | top(total sum(Val)) |
|---|---|---|---|---|
| - | - | 21 | - | 1 |
| 1 | A | 1 | 1 | 1 |
| 2 | A | 3 | 1 | 1 |
| 3 | A | 5 | 1 | 1 |
| 1 | B | 2 | 2 | 1 |
| 2 | B | 4 | 2 | 1 |
| 3 | B | 6 | 2 | 1 |
The top function without the total qualifier will now return the expression evaluated on the top row within the innermost sort group (Grp dimension in this case). One value will be returned for Grp = A and one for Grp = B.
By using the total qualifier in the multi dimension case, you may again refer to the absolute top row of the table with the same value being returned for all rows. The expression will of course be evaluated for the column segment spanning the entire column.
The expression using the top function without he total qualifier will evaluate to NULL in the total row, because it cannot be clearly associated with a specific column segment.
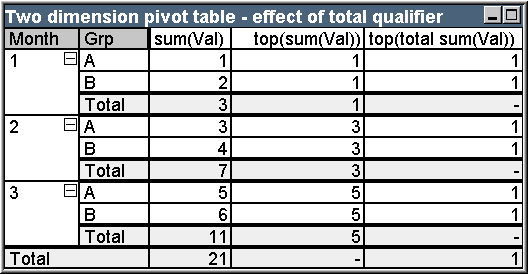
We will now convert the above straight table to a pivot table with all totals activated.
| Month | Grp | sum(Val) | top(sum(Val)) | top(total sum(Val)) |
|---|---|---|---|---|
| 1 | A | 1 | 1 | 1 |
| 1 | B | 2 | 1 | 1 |
| 1 | Total | 3 | 1 | - |
| 2 | A | 3 | 3 | 1 |
| 2 | B | 4 | 3 | 1 |
| 2 | Total | 7 | 3 | - |
| 3 | A | 5 | 5 | 1 |
| 3 | B | 6 | 5 | 1 |
| 3 | Total | 11 | 5 | - |
| Total | - | 21 | - | 1 |
The expression using the top function without he total qualifier will evaluate to NULL in the total row, because it cannot be clearly associated with a specific column segment. However, all the partial sums will be evaluated for each column segment.
The expression using the total qualifier will lack values in the partial totals but will return a value in the grand total row.
Example 3:
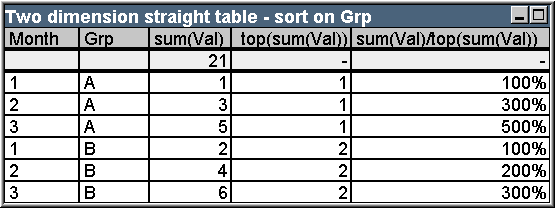
Study the following straight table sorted on the field Grp:
| Month | Grp | sum(Val) | top(sum(Val)) | sum(Val) / top(sum(Val)) |
|---|---|---|---|---|
| - | - | 21 | - | - |
| 1 | A | 1 | 1 | 100% |
| 2 | A | 3 | 1 | 300% |
| 3 | A | 5 | 1 | 500% |
| 1 | B | 2 | 2 | 100% |
| 2 | B | 4 | 2 | 200% |
| 3 | B | 6 | 2 | 300% |
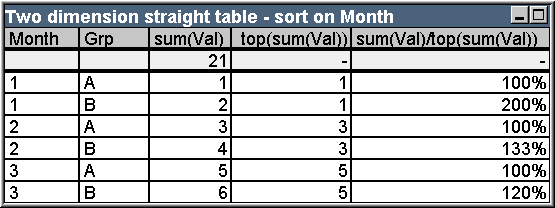
We may continue by changing the inter field sort order so that the chart is sorted primarily on the field Month. The table will now look like this:
| Month | Grp | sum(Val) | top(sum(Val)) | sum(Val) / top(sum(Val)) |
|---|---|---|---|---|
| - | - | 21 | - | - |
| 1 | A | 1 | 1 | 100% |
| 1 | B | 2 | 1 | 200% |
| 2 | A | 3 | 3 | 100% |
| 2 | B | 4 | 3 | 133% |
| 3 | A | 5 | 5 | 100% |
| 3 | B | 6 | 5 | 120% |
Above Function Examples
These examples are made with the above function, but may be applied in a similar manner to the below, before and after functions. However, note that the before and after functions are relevant only to pivot tables.
Example 4:
Study the straight table below, depicting the use of the above function in a one-dimensional table:

| Month | sum(Val) | above(sum(Val)) | sum(Val) / above(sum(Val)) |
|---|---|---|---|
| - | 21 | - | - |
| 1 | 3 | - | - |
| 2 | 7 | 3 | 233% |
| 3 | 11 | 7 | 157% |
The third column shows the expression sum(Val) evaluated one row above the current row, which can be confirmed by comparing with the values for sum(val) in the second column. The above function returns NULL on the first row, as there is no row above on which to evaluate the expression. The above function always returns NULL on all total rows.
The fourth column demonstrates the most typical use of this function, i.e. to calculate the difference between e.g. different time periods.
Example 5:
Study the two-dimensional pivot table below:
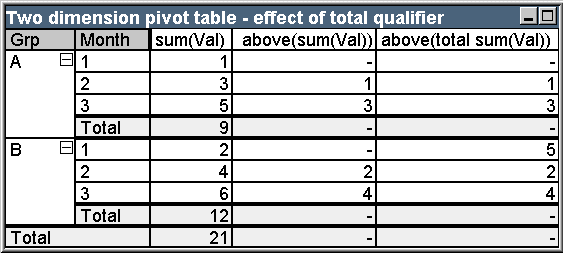
| Grp | Month | sum(Val) | above(sum(Val)) | above(total sum(Val)) |
|---|---|---|---|---|
| A | 1 | 1 | - | - |
| A | 2 | 3 | 1 | 1 |
| A | 3 | 5 | 3 | 3 |
| A | Total | 9 | - | - |
| B | 1 | 2 | - | 5 |
| B | 2 | 4 | 2 | 2 |
| B | 3 | 6 | 4 | 4 |
| B | Total | 12 | - | - |
| Total | - | 21 | - | - |
The above function without the total qualifier (third column) will only act within each sort group. A NULL value will be returned on the top row of each column segment.
When a total qualifier is added (fourth column), the entire column will be regarded as one column segment. Only the top row will return NULL. All total rows are disregarded and return NULL.
RowNo and NoOfRows Function Examples
This example is made with the RowNo and NoOfRows functions, but may be applied in a similar manner to the ColumnNo and NoOfColumns functions. However, note that the ColumnNo and NoOfColumns functions are relevant only to pivot tables.
Example 6:
Study the two-dimensional pivot table below:
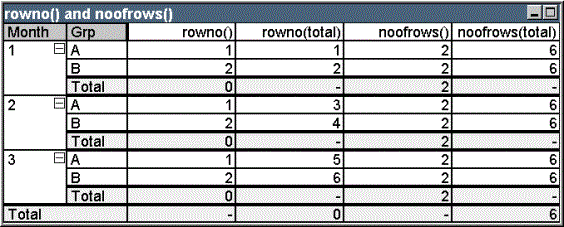
| Month | Grp | RowNo() | RowNo(total) | NoOfRows() | NoOfRows(total) |
|---|---|---|---|---|---|
| 1 | A | 1 | 1 | 2 | 6 |
| 1 | B | 2 | 2 | 2 | 6 |
| 1 | Total | 0 | - | 2 | - |
| 2 | A | 1 | 3 | 2 | 6 |
| 2 | B | 2 | 4 | 2 | 6 |
| 2 | Total | 0 | - | 2 | - |
| 3 | A | 1 | 5 | 2 | 6 |
| 3 | B | 2 | 6 | 2 | 6 |
| 3 | Total | 0 | - | 2 | - |
| Total | - | - | 0 | - | 6 |
- Column 3 The RowNo function will return the row number within each sort group column segment. In subtotal rows, the row number 0 will be returned, because these totals clearly belong to a specific column segment. NULL will be returned in the grand total row.
- Column 4 With the total qualifier, the RowNo function will return the row number within the entire column. In subtotal rows a NULL value will be returned. In the grand total row 0 will be returned.
- Column 5 The NoOfRows function will return the number of data rows within each sort group column segment. In subtotal rows, the same number will be returned as in data rows. NULL will be returned in the grand total row.
- Column 6 With the total qualifier, the NoOfRows function will return the number of data rows within the entire column, which is the same as what will be returned in the grand total row. In subtotal rows NULL will be returned.
