
Image dimensions
You can change the size of objects exported as images from QlikView and Qlik Sense. You can also change how much data is shown in each image.
This page applies to Excel, Word, PowerPoint, and HTML reports. Microsoft Office reports maintain image dimensions as defined at the moment the image is dropped into the report template.
If an image does not look correct in Qlik NPrinting Designer preview, refresh the connection cache. It may have changed in Qlik Sense or QlikView, but the metadata cache was not refreshed in Qlik NPrinting. See: Reloading connection metadata.
Limitations
-
HTML and QlikEntity report templates do not have the stretch image option.
-
If you add an image from QlikView, and then add filters, the image may become distorted due to changes in dimensions.
-
Information noteQlik Sense sheets can be used as images in report templates. However, if your sheet contains unsupported objects, parts of the image will be blank.
Adding one chart with multiple image sizes
When you use the Images node to add a Qlik object, that image can be used multiple times in your report. However, it will be the same size every time. An image object cannot have two different formatting properties. If you want to show the same chart in a report, but in different sizes, you will need to add it twice using the Images node.
For example, you want to add Sales by Country as an image to your report. You want to use it as a thumbnail on one page, and you want it large enough to display all its data on another. Add the object using the Images node: CH304 - Sales by Country. In the Properties pane, set Stretch to Fit Inside, and reduce the image dimensions so it can be used as a thumbnail. Go back to the Images node, and add the same object. It will have a slightly different name: CH304 - Sales by Country_1. In the Propertiespane, set Stretch to Fit Width, so that the image fills the entire width of the report page.
Changing image size of QlikView charts
When you generate a preview or report, QlikView charts are resized in QlikView according to template specifications, and then a screenshot is taken. This screenshot is what you see in a generated report. You can change the size and aspect ratio of chart images in the Properties pane.
Max Width and Max Height
The Max Width and Max Height parameters define the output image size in pixels. They can be explicitly set in Excel templates. They can be implicitly retrieved by the image placeholder, in Word and PowerPoint templates. When these parameters can be explicitly set, (0,0) means “Auto”.
Stretch parameters
The Stretch option can be set to the following:
- Don't Fit: Image will be the same size as it is in QlikView. Template settings will be ignored. Image may overlap other content.
- Fit Inside (default): Image height and width are reduced until both fit the settings in the template. Aspect ratio is kept. Image may become compressed and information may be missing.
- Fit Width: Image is reduced until width is the same as Max Width set in the template. Image height is adjusted to preserve aspect ratio. Max Height is ignored.
- Fit Height: Image is reduced until height is the same as Max Height set in the template. Image width is adjusted to preserve aspect ratio. Max Width is ignored.
- Stretch: Image dimensions are increased or decreased until both height and width are the same as set in the template. Aspect ratio is not maintained.
Changing how QlikView charts are exported
The export behavior was different if you were using:
- Qlik NPrinting June 2018 and earlier
- QlikView 12.20 SR6 and earlier
QlikView would screenshot the chart, and then it would be resized. You can revert to this older behavior in newer versions of Qlik NPrinting by editing the QlikView.config file.
Do the following:
- Stop the Qlik NPrinting Engine service.
-
Open the QlikView.config configuration file.
The default path is: C:\Program Files\NPrintingServer\NPrinting\Engine\QlikView.config
- Find the useAdvancedImageExport flag.
-
Remove the comment characters. Change <useAdvancedImageExport value="true" /> to <useAdvancedImageExport value="false" />.
- Save the file and restart the service.
- Repeat this process on all engine servers.
Example: PowerPoint report with different QlikView chart sizes
This example shows the different image dimension options in a PowerPoint report template, but is relevant to Excel and Word reports. It uses a connection to the Sales Demo QlikView sample document, which can be downloaded at Sample files.
Adding an image with the Don't Fit property
Do the following:
- Create a PowerPoint report using the Sales Demo document, and then open the Template Editor.
-
On the left pane, right-click on Images, and select Add objects.
-
Select CH304 - Sales by Country.
The original object is 9.16 cm high x 14.93 cm wide.
If the Properties pane is not open, right-click on the object node in the Template Editor, and then select Properties.
- Click the Stretch Value cell and select Don't Fit from the drop-down list.
- Drag and drop CH304 - Sales by Country into the template.
- Select the CH304 - Sales by Country image.
- In the PowerPoint ribbon, go to Picture Tools and then Format.
- Expand the Size tool by clicking on the icon in the lower right corner of the Size group.
- Clear the Lock aspect ratio check box.
- Change the Height to 8.75 cm and the Width to 20 cm.
Adding an image with the Fit Inside property
Do the following:
- On the PowerPoint ribbon, click the Home tab .
- Click the New Slide icon.
- On the left pane, right-click on Images, and select Add objects.
- Add CH304 - Sales by Country to the template again.
- This image will be automatically named CH304_1 - Sales by Country.
- In the Properties panel, set the Stretch property to Fit Inside .
- Drag and drop CH304_1 - Sales by Country into the template.
- Select the CH304_1 - Sales by Country image.
- In the PowerPoint ribbon, go to Picture Tools and then Format.
- Expand the Size tool, and clear the Lock aspect ratio check box.
- Change the Height to 8.75 cm and the Width to 20 cm.
Adding an image with the Fit Width property
Do the following:
- On the PowerPoint ribbon, click the Home tab .
- Click the New Slide icon.
- On the left pane, right-click on Images, and select Add objects.
-
Add CH304 - Sales by Country to the template again.
This image will be automatically named CH304_2 - Sales by Country.
- In the Properties panel, set the Stretch property to Fit Width.
- Drag and drop CH304_2 - Sales by Country into the template.
- Select the CH304_2 - Sales by Country image.
- In the PowerPoint ribbon, go to Picture Tools and then Format.
- Expand the Size tool, and clear the Lock aspect ratio check box.
- Change the Height and Width to 12.7 cm.
- Click on Close at the bottom right of the window.
Adding an image with the Fit Height property
Do the following:
- On the PowerPoint ribbon, click the Home tab .
- Click the New Slide icon.
- On the left pane, right-click on Images, and select Add objects.
-
Add CH304 - Sales by Country to the template again.
This image will be automatically named CH304_3 - Sales by Country.
- In the Properties panel, set the Stretch property to Fit Height.
- Drag and drop CH304_3 - Sales by Country into the template.
- Select the CH304_3 - Sales by Country image.
- Select Format under Picture Tools.
- Expand the Size tool, and clear the Lock aspect ratio check box.
- Change the Height and Width to 12.7 cm.
Adding an image and adjusting it manually
Do the following:
- On the PowerPoint ribbon, click the Home tab .
- Click the New Slide icon.
- On the left pane, right-click on Images, and select Add objects.
-
Add CH304 - Sales by Country to the template again.
This image will be automatically named CH304_4 - Sales by Country.
- In the Properties panel, set the Stretch property to Fit Inside.
- Drag and drop CH304_4 - Sales by Country into the template.
- Select the CH304_4 - Sales by Country image.
- Adjust the image size to fill the slide by dragging a corner handle, and then repositioning the image until it fills the slide appropriately.
Previewing the report
You can now see how the five different sizing options display your image differently.
Do the following:
- Click on Preview. You will see the following:
- Slide 1 - Don't fit
The image is the same size as it was in the QlikView document, 9.16 cm x 14.93 cm. Qlik NPrinting has ignored the height and width settings.
- Slide 2 - Fit Inside
The image has the height specified in height setting, 8.75 cm, and the width has been adjusted proportionately to 14.26 cm.
- Slide 3 - Fit Width
The image width has been reduced to the specified 12.7 cm width, and the height has been adjusted proportionately to 7.79 cm.
- Slide 4 - Fit Height
The image height and width may be equal to or less than the original image dimensions. Even though the height was set to 12.7 cm, the height remains 9.16 cm and the width remains 14.93 cm.
- Slide 5 - Fit Inside with manually re-size
The image is the same size as the original, 9.16 cm x 14.93 cm. The image is positioned in the top left corner.
Changing image size of Qlik Sense charts
By default, Qlik Sense charts exported into Qlik NPrinting will look exactly as they do in the connected Qlik Sense app. For example, you have a large bar chart which contains twelve months of data, that can be viewed using scroll bars. You reload the connection metadata when the chart is displaying data from February to June. If you add this chart as an image in Qlik NPrinting Designer, that image will only show February to June data, like a snapshot.
Data Displayed parameters
Under the Properties pane, you can use Data Displayed Width (px) and Data Displayed Height (px) to adjust how much chart data is displayed in the image. These two parameters decide how much data should be captured by Qlik NPrinting when exporting a chart from Qlik Sense, regardless of the chart’s final size in the report. Using the same example, if you want to see bar chart data from January to December, you can do so by adjusting Data Displayed. You could also choose to only display January. These parameters define the “original” chart size: the size of the snapshot of the chart we want to export.
If you have edited your Qlik Sense app, you must regenerate the connection cache if you want to see updated Data Displayed parameters .
The default Data Displayed size is (0,0), which means “Auto”. Both parameters must be greater than 0, otherwise they will be ignored.
Max Width and Max Height
The Max Width and Max Height parameters define the output image size in pixels. They can be explicitly set in Excel templates. They can be implicitly retrieved by the image placeholder, in Word and PowerPoint templates.
When these parameters can be explicitly set, (0,0) means “Auto”, which is what is captured by the snapshot. This means your Data Displayed parameters are considered to also be the output image size.
Stretch parameters
You can use the Stretch option can be set to the following:
- Don’t Fit: Max Width and Max Height measures are ignored. Data Displayed size, whether customized or chosen automatically, is the final output size.
- Fit Inside: the chart’s aspect ratio is set by the Data Displayed values. The image will fit both Max Width and Max Height values. The image will not be padded with a transparent or blank area to reach Max Width and Max Height size.
- Fit Width: the chart’s aspect ratio is set by the Data Displayed values. The image will fit the Max Width measure. The image will not be cut to reach Max Width and Max Height size.
- Fit Height: the chart’s aspect ratio is set by the Data Displayed values. The image will fit the Max Height measure. The image will not be cut to reach Max Width and Max Height size.
- Stretch: the aspect ratio set by Data Displayed is not kept. Instead, Qlik NPrinting tries to show either the same amount or more data while filling the entire Max Width and Max Height area. The image will not be deformed or padded with a blank area.
Example: Excel report with different Qlik Sense chart sizes
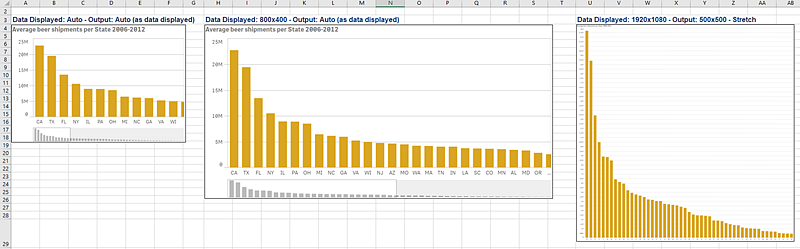
These examples were made using the same Qlik Sense chart. They were all put into an Excel report, with different Data Displayed, Max Width, Max Height, and Stretch values.
The example has three chart images, from left to right:
- Data Displayed: Auto, Output: Auto
- Data Displayed: 800x400 px, Output: Auto
- Data Displayed: 1920x1080 px, Output: 500x500 px, Stretch
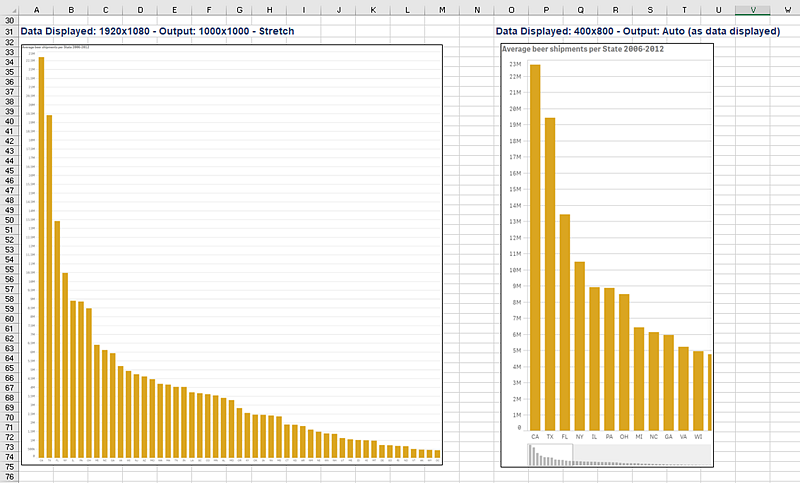
The second example has two chart images, from left to right:
-
Data Displayed: 1920x1080 px, Output: 1000x1000 px, Stretch
-
Data Displayed: 400x800 px, Output: Auto
Changing image size in PixelPerfect reports
PixelPerfect reports have different image Stretch options:
- Normal: The image is displayed with its original dimensions.
- StretchImage: The image is stretched to fill both the control's width and height.
- AutoSize: The control's dimensions are auto-adjusted to the image size.
- ZoomImage: The image is proportionally resized, so that it fits the control.
- Squeeze: If the control's dimensions exceed the image size, the image is centered and shown full-size. Otherwise, the image is resized to fit into the control's dimensions.
- Tile: The original image is replicated within the picture control starting from the upper-left corner. The replicated image is clipped if it does not fit in the picture control which contains it.