
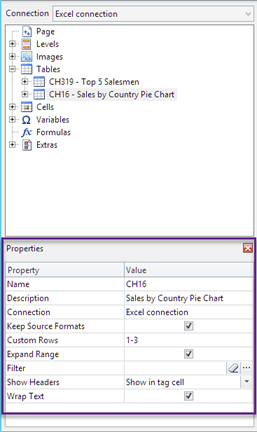
Qlik NPrinting Designer Properties pane
The Properties pane lets you customize chart objects in Excel, Word, PowerPoint, and HTML report templates.
The Properties pane will display different settings, depending on:
- the object type you have currently selected (in the left-hand pane, not the template)
-
the report type you are working on
| Property | All objects | Tables | Images |
Levels |
|---|---|---|---|---|
|
Name |
Yes | No | No | No |
| Description | Yes | No | No | No |
| Connection | Yes | No | No | No |
| Keep Source Formats | No | Yes | Yes | Yes |
| Custom Rows | No | Yes | No | No |
| Expand range | No | Yes | No | No |
| Filter | No | Yes | Yes | No |
| Show Headers | No | Yes | No | No |
| Wrap text | No | Yes | No | No |
| Max Height and Max Width | No | No | Yes | No |
| Stretch | No | No | Yes | No |
Name
The name of the object. This is the object ID.
Description
The object description retrieved from QlikView or Qlik Sense.
Connection
The Qlik Sense or QlikView connection that contains the object.
Keep Source Formats
Keep Source Formats is available for all fields in the Pages and Levels node, and for fields and objects in the Tables node. By default, Qlik NPrinting tries to keep original chart object formats. You can remove original formats and apply your own by clearing the Keep Source Formats check box.
By removing Keep Source Formats from tables, you can apply Excel, PowerPoint, Word, HTMLor features and numeric formats to the columns in the report. By removing Keep Source Formats from pages and levels, you can apply formats to the cells in the report. To apply graphical formats, you do not need to remove Keep Source Formats. After clearing Keep Source Formats, the Format option appears. You can use this to specify a custom numeric format.
Limitations
If you apply Keep Source Formats to Qlik Sense columns only the following formats are kept:
- URLs
- color of text (foreground color) in tables
- background color of tables
All other formatting options (such as table borders, text alignment inside cells, text formatting) are not supported.
Custom fonts may not render properly in reports. See: Fonts do not display properly in reports.
Tables
Tables or columns from tables exported from QlikView or Qlik Sense can be presented with the same formatting as the original document or app. However, you may also want to customize this information.
For example: after clearing the Keep Source Formats check box, you can apply formatting to a table as a whole or to component columns. Both numerical and time/date data are numerical entities. When Keep Source Formats is deactivated for a column, a row presenting a new Format field appears. You can set specific formatting for the column data by entering a code. Examples are #,##0.00, 0,00%, € #,##0.
You need to clear Keep Source Formats if you want to change column or row sizes.
Deactivating Keep Source Formats
The following lists the results of the various combinations of choices for different templates:
Without setting a format code in the format field
- Excel: the Excel format is applied to the cell containing the field tag.
- Word and PowerPoint: the relative format is applied to the entity at the point of field tag embedding.
- HTML: the inline style set for the field tag container (div, span, p, th, td, li, etc.) is applied.
By entering a format code in the format field
- Excel: the code in the Format field defines the numerical or time/date format, while graphic style is controlled by the Excel format tools applied to the cell containing the field tag (color, font, size, style, justification, etc.)
- Word and PowerPoint: both the relative format and the format field are applied to the entity or container at the point of field tag embedding
- HTML: both the inline style set and the format field are applied for the field tag container
For a field used in a level
Time, date, or numerical type of data is determined by the QlikView tag associated with the field. This can be determined by opening the QlikView document in QlikView and pressing Ctrl + Alt + D, selecting the Tables tab, and looking in the Tags column of the Fields list next to the Field name. If $date or $timestamp, or both, appear, then the field is a time/date type. These tags are associated automatically on Reload.
Format field
The following sections list the effects that the elements have that are used to compose the formatting code. This code is entered into the Format field that appears after deactivating Keep Source Formats.
| Specifier | Represents |
|---|---|
| 0 | Digit placeholder. If the value being formatted has a digit in the position where '0' appears in the format string, then that digit is copied to the output string. Otherwise, a '0' is stored in that position in the output string. |
| # | Digit placeholder. If the value being formatted has a digit in the position where '#' appears in the format string, then that digit is copied to the output string. Otherwise, nothing is stored in that position in the output string. |
| . | Decimal point. The first '.' character in the format string determines the location of the decimal separator in the formatted value; any additional '.' characters are ignored. The actual character used as a decimal separator in the output string is determined by the DecimalSeparator global variable or its TFormatSettings equivalent. |
| , | Thousand separator. If the format string contains one or more ',' characters, the output will have thousand separators inserted between each group of three digits to the left of the decimal point. The placement and number of ',' characters in the format string does not affect the output, except to indicate that thousand separators are wanted. The actual character used as a thousand separator in the output is determined by the ThousandSeparator global variable or its TFormatSettings equivalent. |
| E+ | Scientific notation. If any of the strings 'E+', 'E-', 'e+', or 'e-' are contained in the format string, the number is formatted using scientific notation. A group of up to four '0' characters can immediately follow the 'E+', 'E-', 'e+', or 'e-' to determine the minimum number of digits in the exponent. The 'E+' and 'e+' formats cause a plus sign to be output for positive exponents and a minus sign to be output for negative exponents. The 'E-' and 'e-' formats output a sign character only for negative exponents. |
| 'xx'/"xx" | Characters enclosed in single or double quotation marks are output as such and do not affect formatting. |
| ; | Separates sections for positive, negative, and zero numbers in the format string. |
| Specifier | Displays |
|---|---|
| c | Displays the date using the format given by the ShortDateFormat global variable, followed by the time using the format given by the LongTimeFormat global variable. The time is not displayed if the date-time value indicates midnight precisely. |
| d | Displays the day as a number without a leading zero (1-31). |
| dd | Displays the day as a number with a leading zero (01-31). |
| ddd | Displays the day as an abbreviation (Sun-Sat) using the strings given by the ShortDayNames global variable. |
| dddd | Displays the day as a full name (Sunday-Saturday) using the strings given by the LongDayNames global variable. |
| ddddd | Displays the date using the format given by the ShortDateFormat global variable. |
| dddddd | Displays the date using the format given by the LongDateFormat global variable. |
| e | (Windows only) Displays the year in the current period/era as a number without a leading zero (Japanese, Korean, and Taiwanese locales only). |
| ee | (Windows only) Displays the year in the current period/era as a number with a leading zero (Japanese, Korean, and Taiwanese locales only). |
| g | (Windows only) Displays the period/era as an abbreviation (Japanese and Taiwanese locales only). |
| gg | (Windows only) Displays the period/era as a full name (Japanese and Taiwanese locales only). |
| m | Displays the month as a number without a leading zero (1-12). If the m specifier immediately follows an h or hh specifier, the minute rather than the month is displayed. |
| mm | Displays the month as a number with a leading zero (01-12). If the mm specifier immediately follows an h or hh specifier, the minute rather than the month is displayed. |
| mmm | Displays the month as an abbreviation (Jan-Dec) using the strings given by the ShortMonthNames global variable. |
| mmmm | Displays the month as a full name (January-December) using the strings given by the LongMonthNames global variable. |
| yy | Displays the year as a two-digit number (00-99). |
| yyy | Displays the year as a four-digit number (0000-9999). |
| h | Displays the hour without a leading zero (0-23). |
| hh | Displays the hour with a leading zero (00-23). |
| n | Displays the minute without a leading zero (0-59). |
| nn | Displays the minute with a leading zero (00-59). |
| s | Displays the second without a leading zero (0-59). |
| ss | Displays the second with a leading zero (00-59). |
| z | Displays the millisecond without a leading zero (0-999). |
| zzz | Displays the millisecond with a leading zero (000-999). |
| t | Displays the time using the format given by the ShortTimeFormat global variable. |
| tt\ | Displays the time using the format given by the LongTimeFormat global variable. |
| am/pm | Uses the 12-hour clock for the preceding h or hh specifier, and displays 'am' for any hour before noon, and 'pm' for any hour after noon. The am/pm specifier can use lower, upper, or mixed case, and the result is displayed accordingly. |
| a/p | Uses the 12-hour clock for the preceding h or hh specifier, and displays 'a' for any hour before noon, and 'p' for any hour after noon. The a/p specifier can use lower, upper, or mixed case, and the result is displayed accordingly. |
| ampm | Uses the 12-hour clock for the preceding h or hh specifier, and displays the contents of the TimeAMString global variable for any hour before noon, and the contents of the TimePMString global variable for any hour after noon. |
| / | Displays the date separator character given by the DateSeparator global variable. |
| : | Displays the time separator character given by the TimeSeparator global variable. |
| 'xx'/"xx" | Characters enclosed in single or double quotation marks are displayed as such, and do not affect formatting. |
Changing currency separation symbols
Some regions use periods to format currency, and some use commas. For example: $347.89 or € 347,89. You can change the decimal separator used in report output files.
Do the following:
- Log into the Qlik NPrinting Engine computers via RDP as the Windows users that runs the Qlik NPrinting Engine service.
- Change the region settings in the Control Panel.
- Restart the Engine service.
This process must be repeated on all Qlik NPrinting Engine computers.
Custom rows
The Custom rows setting appears if you add a table to the template. You can choose to only display certain specific table rows. For example, if you input 1-4, users will only see the first four rows of the table in their reports.
Expand range
The Expand Range setting only appears if you add a table to an Excel template. If the Expand Range check box is flagged (default), Qlik NPrinting will add an adequate number of rows under the table or column tags to avoid overlap with table tags placed underneath. If the Expand Range option is cleared, Qlik NPrinting will not add rows under the table or column tags. You must manually manage the position of other table tags. However, Excel formulas can be added to the table, because the references will be kept.
Filter
You can add object filters to tables and images. See: Applying a filter to an object.
Show Headers
The Show Headers property appears if you add a table. It has three options:
- Hide: Qlik NPrinting will not add headers. You can type them manually, or obtain dynamic headers using variables and Excel formulas.
- Show in tag cell: column headers will be inserted in the tag cells and data will start in the row below. Formulas and variables in original QlikView or Qlik Sense headers will not be replaced.
- Show above tag cell: column headers will be inserted in the row above tag cells. Data will start on the row with the tags. Use this option when column headers in the original connection use variables or formulas and you want them to be reported in the table.
If you add an entire table object to the template, Qlik NPrinting will add the object tag (for example: <CH123>). The only way to control column headers is the Show headers setting.
If you add columns individually from a table, Qlik NPrinting will create Excel text cells with the headers, even if you set Hide. You can keep and format the headers, or you can delete them and set Show Headers to other values.
Wrap text
This setting will wrap text in table cells.
Max Height and Max Width
You can set a max height and max width for images. In QlikView connections, the Max Width and Max Height parameters define the output image size in pixels. They can be explicitly set in Excel templates. They can be implicitly retrieved by the image placeholder, in Word and PowerPoint templates. When these parameters can be explicitly set, (0,0) means “Auto”.
In Qlik Sense connections, the Max Width and Max Height parameters define the output image size in pixels. They can be explicitly set in Excel templates. They can be implicitly retrieved by the image placeholder, in Word and PowerPoint templates. When these parameters can be explicitly set, (0,0) means “Auto”, which is what is captured by the snapshot. This means your Data Displayed parameters are considered to also be the output image size.
See: Image dimensions.
Stretch
You can resize images using the Stretch property. This setting behaves differently depending on your connection type.
QlikView connections
The Stretch option can be set to the following:
- Don't Fit: Image will be the same size as it is in QlikView. Template settings will be ignored. Image may overlap other content.
- Fit Inside (default): Image height and width are reduced until both fit the settings in the template. Aspect ratio is kept. Image may become compressed and information may be missing.
- Fit Width: Image is reduced until width is the same as Max Width set in the template. Image height is adjusted to preserve aspect ratio. Max Height is ignored.
- Fit Height: Image is reduced until height is the same as Max Height set in the template. Image width is adjusted to preserve aspect ratio. Max Width is ignored.
- Stretch: Image dimensions are increased or decreased until both height and width are the same as set in the template. Aspect ratio is not maintained.
Qlik Sense connections
You can use the Stretch option can be set to the following:
- Don’t Fit: Max Width and Max Height measures are ignored. Data Displayed size, whether customized or chosen automatically, is the final output size.
- Fit Inside: the chart’s aspect ratio is set by the Data Displayed values. The image will fit both Max Width and Max Height values. The image will not be padded with a transparent or blank area to reach Max Width and Max Height size.
- Fit Width: the chart’s aspect ratio is set by the Data Displayed values. The image will fit the Max Width measure. The image will not be cut to reach Max Width and Max Height size.
- Fit Height: the chart’s aspect ratio is set by the Data Displayed values. The image will fit the Max Height measure. The image will not be cut to reach Max Width and Max Height size.
- Stretch: the aspect ratio set by Data Displayed is not kept. Instead, Qlik NPrinting tries to show either the same amount or more data while filling the entire Max Width and Max Height area. The image will not be deformed or padded with a blank area.