Publishing a simple report from a QlikView document
This tutorial will show you how to create and publish a simple Qlik NPrinting PowerPoint report using QlikView data.
Qlik NPrinting has many features. This tutorial is meant to help newer users create their first report. It does not outline every report type, design element, or publishing option. At the end of this tutorial, you will have created, edited, and published a PowerPoint report that is viewable by your selected users.
Other Qlik NPrinting tutorials:
In this tutorial, you will be:
Accessing a QlikView document
Reports need data. Learn how to download and import a sample QlikView document.
Connecting Qlik NPrinting to a QlikView document
Qlik NPrinting needs to connect to your QlikView document. Learn how to configure Qlik NPrinting so it can access a sample document, or your existing QlikView data.
Creating a new Qlik NPrinting report template
Report templates control the layout and output formats of reports. This section will show you how to make a new one.
Editing the report template
Reports offer many different formatting options. In this section, you will add a title, images, table, chart, and pages to your report.
Publishing to NewsStand and email
NewsStand is a web console your users can access to view reports. Learn how to publish your report to the NewsStand and by email.
Accessing a QlikView document
QlikView documents contain the data and visualizations that Qlik NPrinting uses to build reports. There are a few different ways to access a QlikView document.
- You can download a QlikView document from the Qlik help site, and save it to a folder on your computer.
- You can use your own QlikView document, and skip to Connecting Qlik NPrinting to a QlikView document. If you are using your own document to complete this tutorial, pick a simple one. Qlik NPrinting experiences longer load times with complex QlikView documents.
Downloading a QlikView document from the Qlik help site and saving it to your computer
Do the following:
- On the Qlik NPrinting help site, go to Sample files, and download the Examples .zip file to your preferred location on the computer where Qlik NPrinting is installed.
- In Windows, unzip Sales Demo.qvw, and save it in the C:\Program Files\QlikView\Examples\ folder. You should create the folder if it does not already exist.
If you save the files in a different place, this location needs to be substituted for C:\Program Files\QlikView\Examples\ wherever it is specified in the Qlik NPrinting help.
Connecting Qlik NPrinting to a QlikView document
Now we will create a Qlik NPrinting app and connect it to your QlikView document.
Qlik NPrinting apps contains reports, filters, and connections to Qlik Sense apps or QlikView documents. They let the Qlik NPrinting Designer access your data so that it can be used in a report.
Do the following:
- Log into the Qlik NPrinting web console.
- On the main menu, click the Apps drop-down, and select Apps.
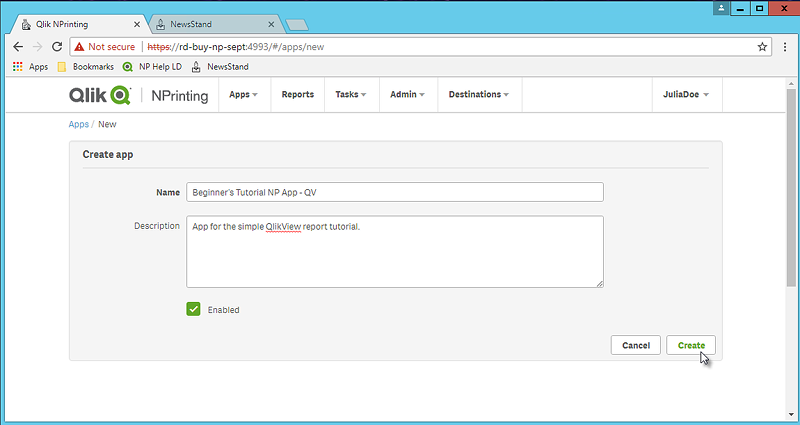
- Click the Create app button.
- Enter a name for this new app. For example: Beginner's Tutorial NP App - QV.
- Ensure the Enabled check box is selected. Otherwise, your app will be ignored by the Qlik NPrinting Engine.
- Click Create.
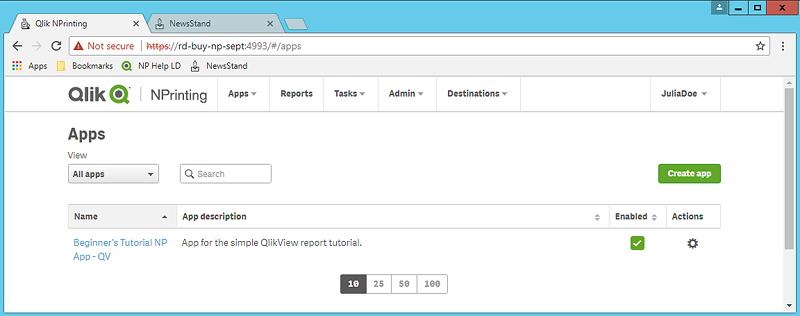
You will now be able to see Beginner's Tutorial NP App - QV under Apps.
- From the main menu, click the Apps drop-down, and select Connections.
- Click the Create connection button.
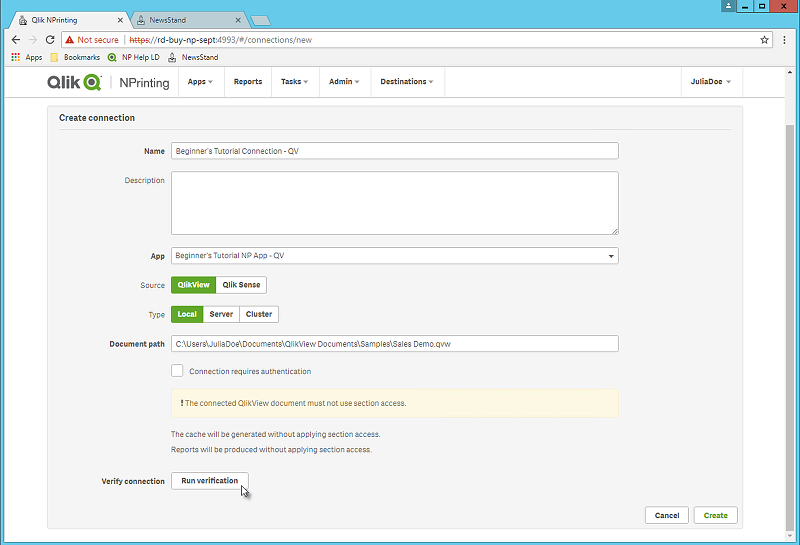
- In the Name box, enter a name for the connection: Beginner's Tutorial Connection - QV.
- In the App drop-down list, select the Qlik NPrinting app that you created previously: Beginner's Tutorial NP App - QV.
- Under Source select QlikView.
- Under Type select Local.
Under Document path, type in the location of the QlikView document you want to connect to.
For example: C:\Program Files\QlikView\Examples\Sales Demo.qvw
Warning noteMapped network drives, like Z:\NPrintingServer\QlikViewDocuments, are not supported by Qlik NPrinting. You must use Universal Naming Convention (UNC) paths, such as \\ServerName\NPrintingServer\QlikViewDocuments.If your QlikView document requires authentication, ensure that Connection requires authentication is checked.
See: Section access.
- Click the Run verification button. This ensures your connection is valid.
If the connection is valid, you will see a "Verification successful" message. If not, you will see the following message: "Errors detected. Check details below."
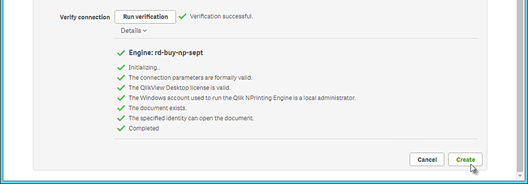
- Once your connection settings have been verified, click Create. You will be automatically moved back to the Connections menu.
- Your new connection will have a Cache status - Generating status. This means that Qlik NPrinting is connecting to QlikView and importing metadata. If you have a large QlikView document, this may take several minutes.
Information note
Every time you add new objects to your QlikView document, you must reload your connection metadata.
- Once the cache status shows Generated, you can create a new report template. If you get an Error status, check your connection information.
You will now be able to see your new connection on the Connections screen.

If you have trouble connecting to your QlikView document, see:
- Connecting to QlikView documents
- Verify connection errors when setting up a connection to QlikView documentsTroubleshooting
Creating a new Qlik NPrinting report template
Report templates control the layout and output formats of reports. You can arrange objects and format pages using the standard options of the report type you choose. For example, a PowerPoint report will have the same formatting options and interface as a PowerPoint deck.
Do the following:
- In the Qlik NPrinting web console, click Reports on the main menu.
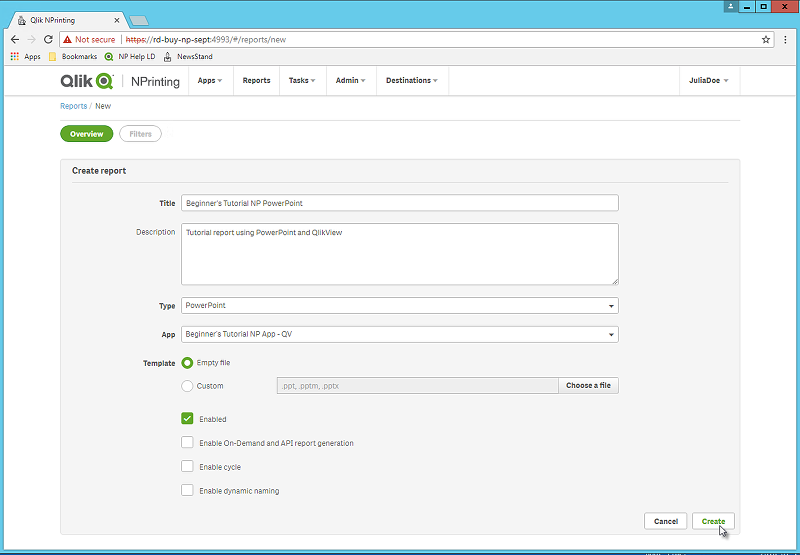
- Click the Create report button.
- Enter a title in the Title field. For example: Beginner's Tutorial NP PowerPoint.
- From the Type drop-down list, select PowerPoint.
- From the App drop-down list, select Beginner's Tutorial NP App - QV.
- From the Template options, click Empty file.
- Ensure the Enabled check box is selected. Otherwise, your report will be ignored by the Qlik NPrinting Engine.
- Click Create.
You will now be able to see Beginner's Tutorial NP PowerPoint under Reports.
Editing the report template
There are many ways to edit a report template. We will be adding:
- Titles: simple text used to organize your report. They can be altered using standard PowerPoint formatting.
- Tables: take your QlikView data and present it in tabular form.
- Images: take your QlikView data and present it as a .png.
-
Charts: take your QlikView table data and present it as a PowerPoint chart.
- Pages: sub-divide your data by a dimension. They can be applied to tables and images. We will be dividing Year and Category Name.
This section does not cover everything you can do in the Qlik NPrinting Designer. If you would like to read about advanced PowerPointreport features, see: PowerPoint reports.
Do the following:
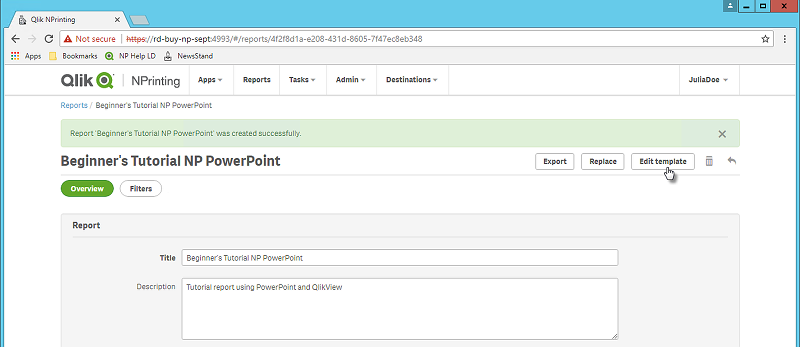
- In the Qlik NPrinting web console, click Reports on the main menu.
- On the Reports screen, click on your report.
- Click the Edit template button to open the Qlik NPrinting Designer template editor.
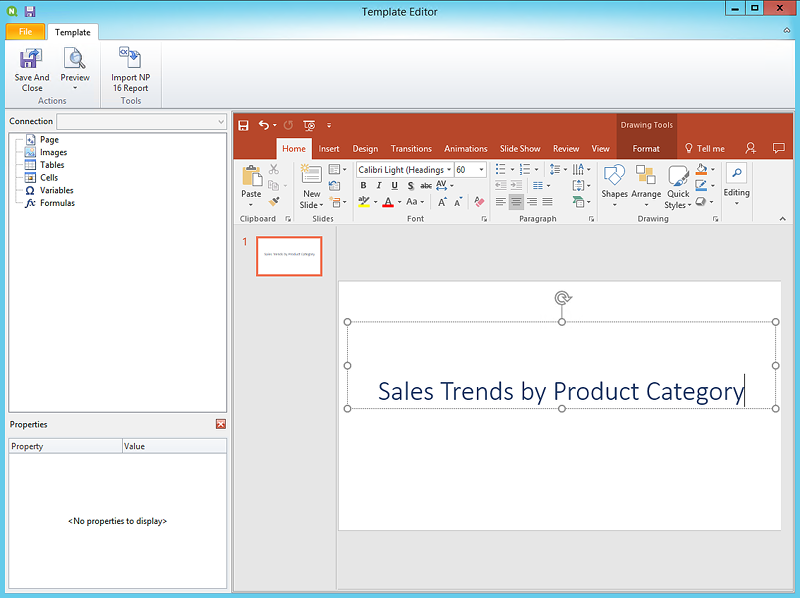
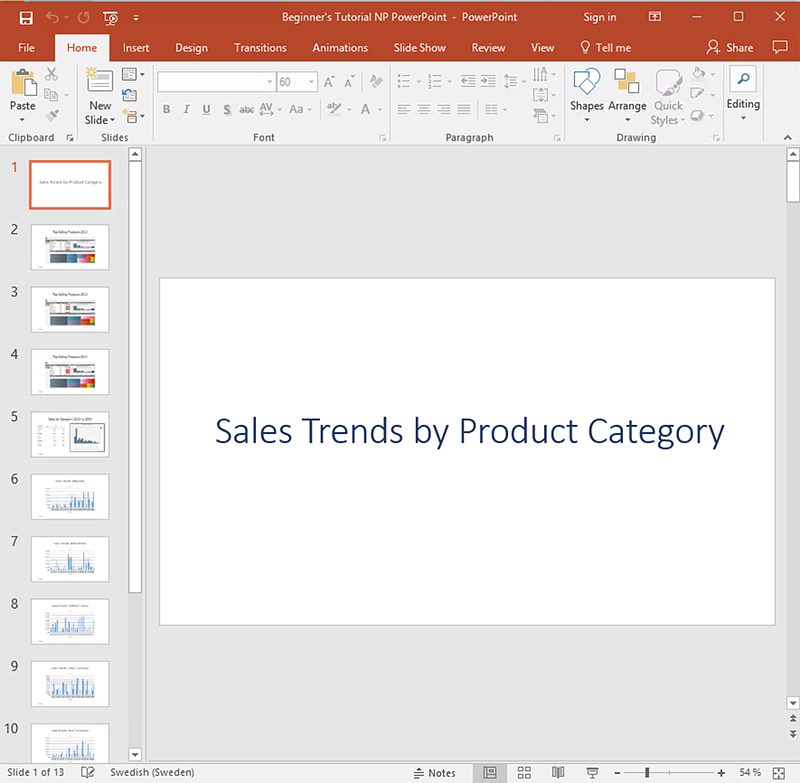
- The Qlik NPrinting Designer opens. Because you are making a PowerPoint report, you will see the standard PowerPoint interface. Most PowerPoint formatting features can be applied to your report using this interface.
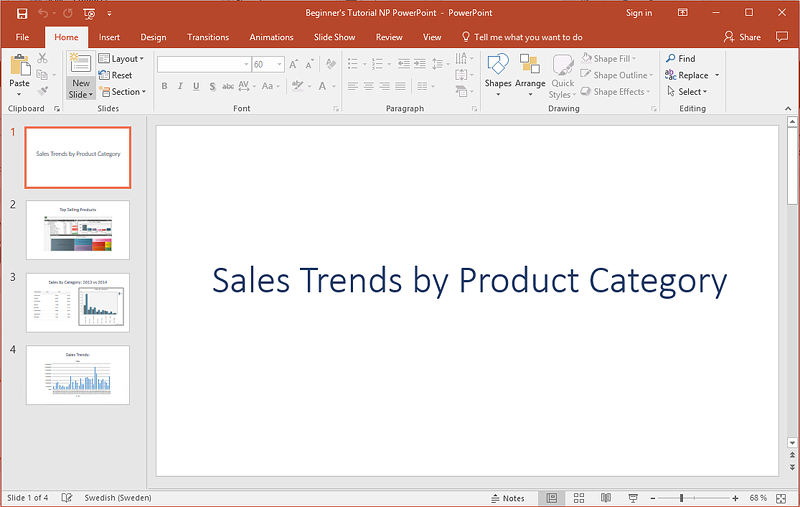
- Enter a title:
- On the first slide, type in a title: For example, "Sales Trends by Product Category".
- Enter a subtitle, or delete the subtitle text box.
 Tip note You can use PowerPoint formatting options to change the look of these titles. For example, you can change the font size and color.
- Add images:
- On the PowerPoint toolbar, click the Insert tab.
- Click the New Slide button.
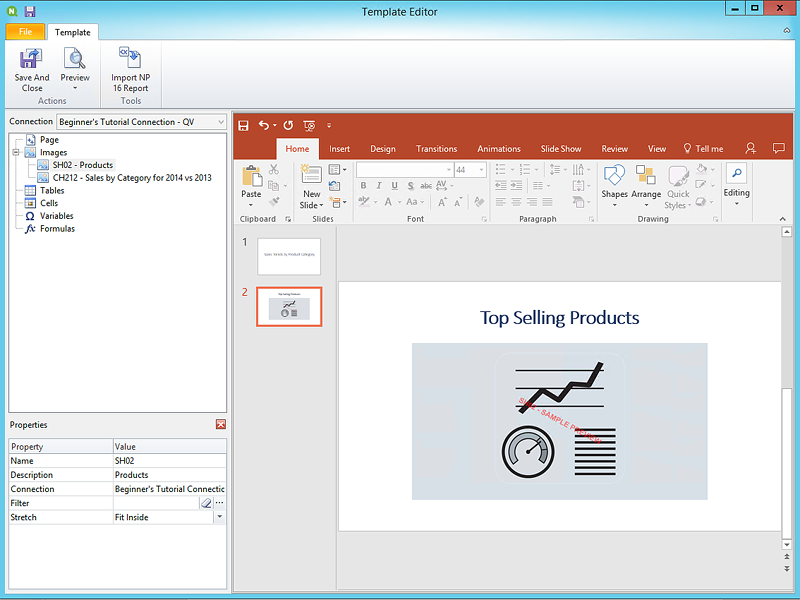
- Type in a title: for example, "Top Selling Products". Delete the second empty text box.
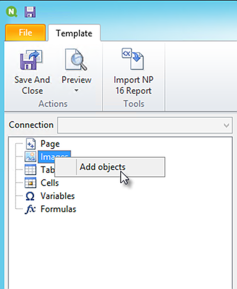
On the left pane, right-click on Images, and select Add objects.
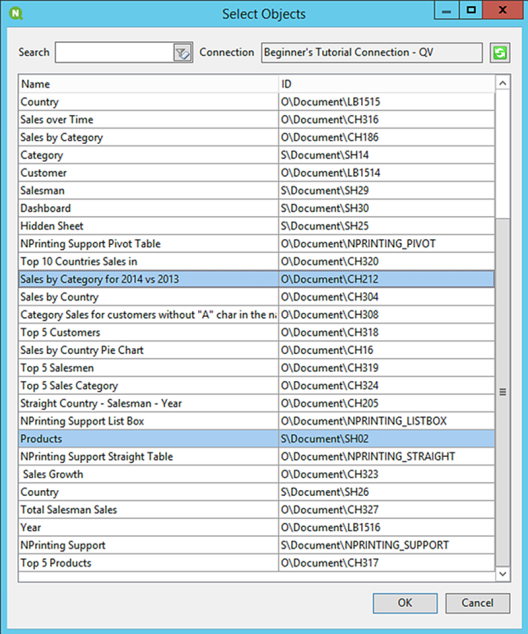
A new window will open. Select Products and Sales by Category for 2014 vs 2013, and click OK.
You can select multiple options by holding down the CTRL button.
Drag SH02 - Products onto the slide.
- On the PowerPoint toolbar, click the Insert tab.
- Click the New Slide button.
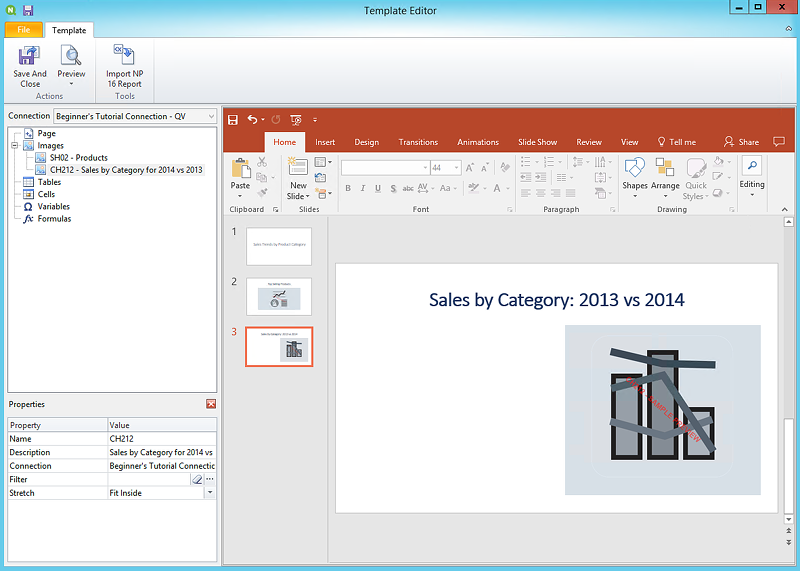
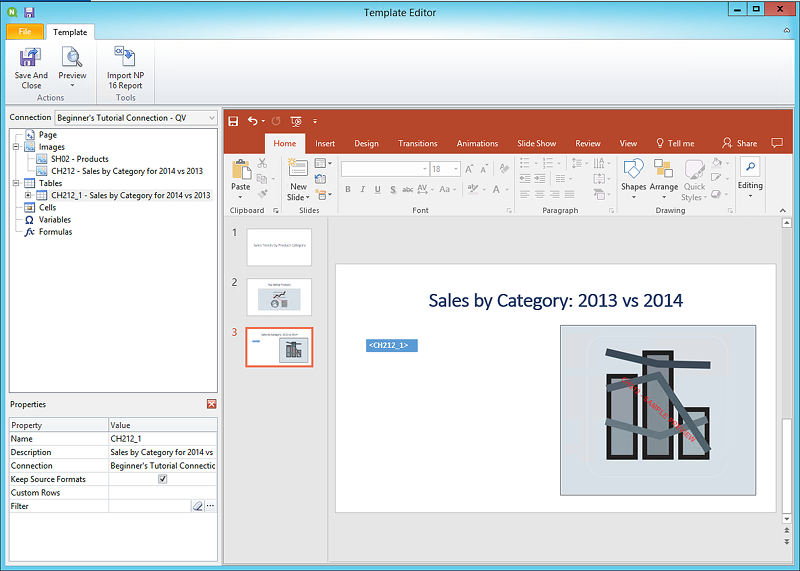
- Type in a title: for example, "Sales by Category: 2013 vs 2014". Delete the second empty text box.
Drag CH212 - Sales by Category for 2014 vs 2013 onto the slide.
- Add a table:
- On the left pane, right-click on Tables, and select Add objects.
A new window will open. Select Sales by Category: 2013 vs 2014. Click OK.
Drag CH212_1 - Sales by Category for 2014 vs 2013 onto the slide.
- Add a PowerPoint native chart:
- On the PowerPoint toolbar, click the Insert tab.
- Click the New Slide button.
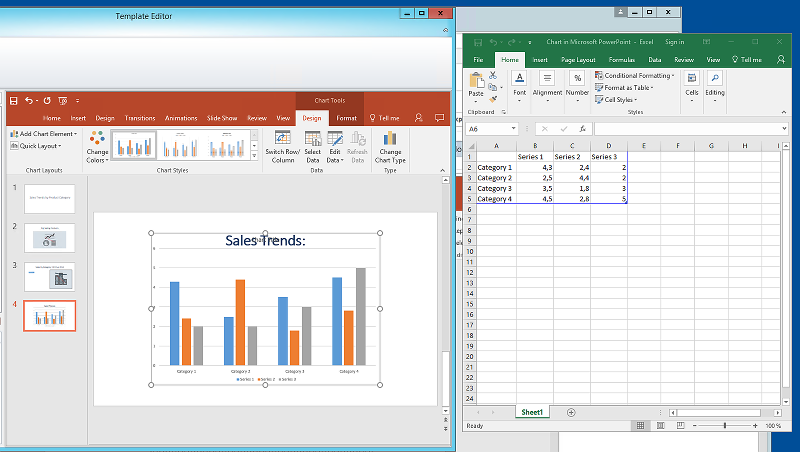
- Type in a title: for example, "Sales Trends:". Delete the second empty text box.
On the left pane, right-click on Tables, and select Add objects.
A new window will open. Select CH326 - Sales by YearMonthNum. Click OK.
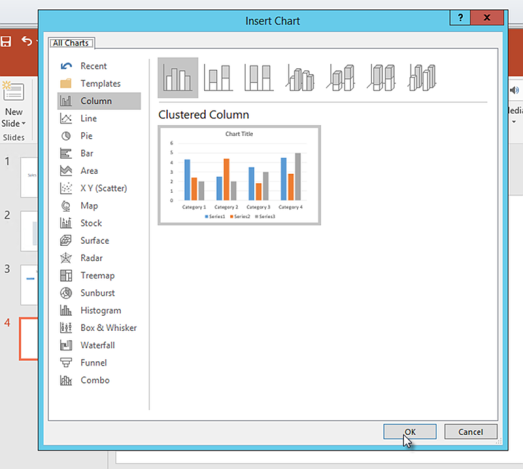
- On the PowerPoint toolbar, select the Insert tab.
- In the Illustrations section, click on Chart .
A new window will open. Under Column, select the first bar chart, and then click OK.
An Excel worksheet will open. This is the data source for your chart.
We will need to insert Qlik NPrinting tags onto this sheet and remove some unnecessary data.
- On the left pane of the PowerPoint interface, expand the CH326 - Sales by YearMonthNum node.
Select the YearMonthNum and Sales tags.
You can select multiple options by holding down the CTRL button.
Drag and drop the Year MonthNum tag into the Excel worksheet, into cell A1. This will make it the y-axis. Drag the Sales tags into cell B1. This will make it the x-axis.
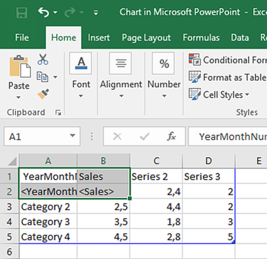
Select and delete columns C and D.
The actual numbers are unnecessary, because Qlik NPrinting will use the tags to build the chart.
Select and delete rows 3, 4, and 5.
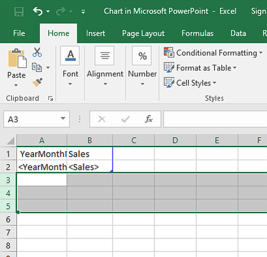
Close Excel.
Your changes will save automatically.
You may need to adjust the size of your chart to make it fit on the slide. You can use the sizing arrows.
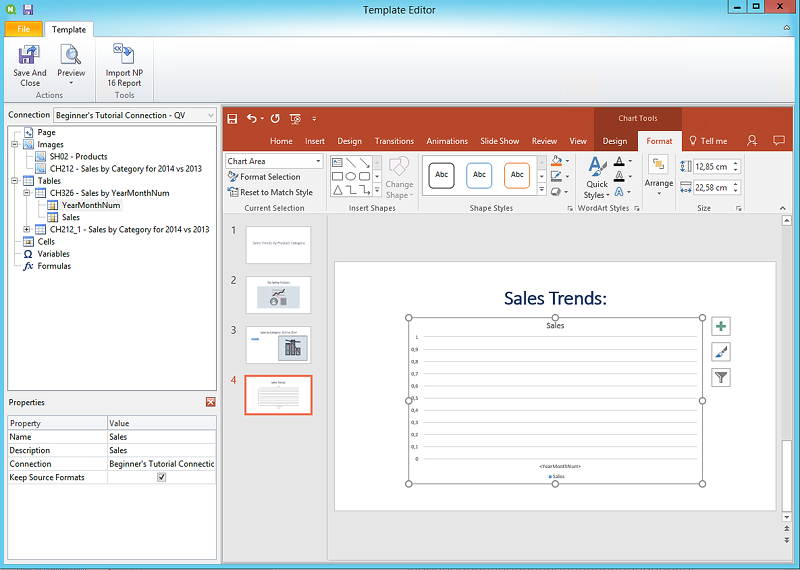
- On the Qlik NPrinting template editor menu, click the File tab. Click Save.
Click the Template tab, and click the Preview button to preview your report.
Your slide show has four slides at the moment.
- Add pages:
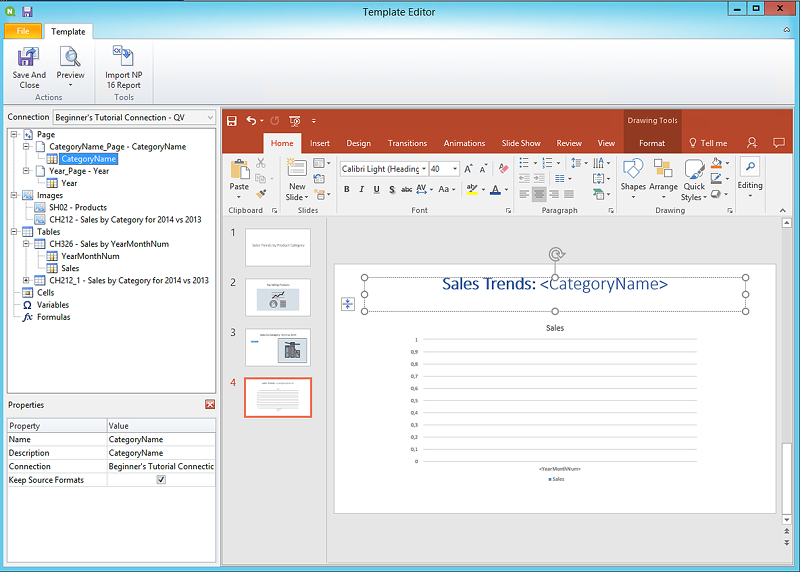
Go to the slide where you want to add the page. In this case, the fourth slide.
Pages are only applied to the current slide.
- On the left pane, right-click on Page, and select Add page to current sheet.
A new window will open. Select CategoryName. Click OK.
Information noteNote: If you add a second page to a slide, the previous page will be overwritten.Expand the CategoryName_Page - CategoryName node. Drag the CategoryName tag onto the slide.
This tag will divide your data by category, with each category going on a separate slide. The <CategoryName> text will change to match the category of each slide. Instead of one slide that says "Sales Trends:", you will have several slides with unique titles: "Sales Trends: Baby Clothes", "Sales Trends: Women's Shoes".
The <CategoryName> tag will appear as a new text box. If you cut and paste this new text into the title text box, you can format it to match the title more easily.
- Go to the second slide, "Top Selling Products".
- On the left pane, right-click on Page, and select Add page to current sheet.
- A new window will open. Select Year. Click OK.
Expand the Year_Page - Year node. Drag the Year tag onto the slide.
It will appear as a new text box. If you cut and paste this new text into the title text box, you can format it to match the title more easily.
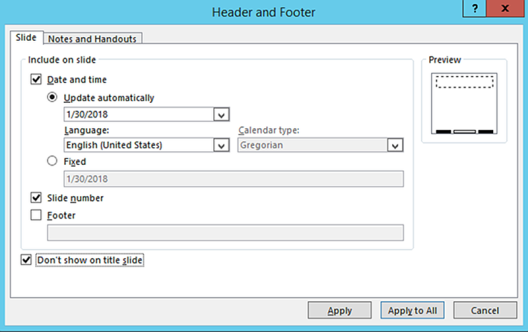
- On the PowerPoint toolbar, click the Insert tab.
- Click the Slide Number button.
A new window will open. Click the Date and time, Slide number, and Don't show on title slide check boxes. Click Apply to All.
It may take several minutes for your preview to load, depending on the size of your report.
You now have a report with 13 slides. The slides with pages applied have expanded to new pages with information divided by the page categories you applied.
In this example, slides 2-4 show data filtered by Year, and slides 6-13 show data filtered by CategoryName.
The report template is now saved and ready to be shared with users.
Publishing to NewsStand and email
Reports need to be published in order for users to access them. We will be publishing to NewsStand and by email.
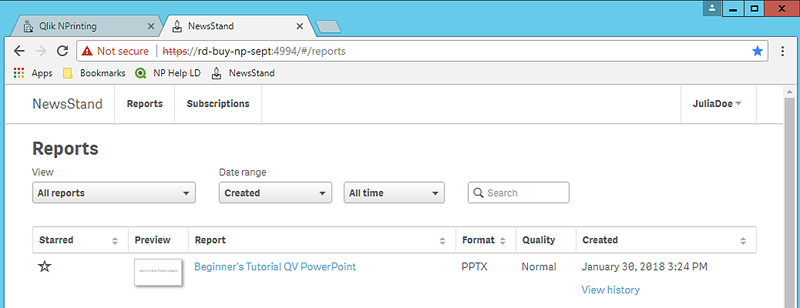
NewsStand is a web portal that allows users to preview and download reports, and subscribe to automatic updates. See: NewsStand overview
Emails contain your reports as attachments. Their contents can be customized by adding text and images. See: Distributing reports by email.
Do the following:
- In the Qlik NPrinting web console, click Tasks on the main menu, and select Publish task.
- Click the Create task button.
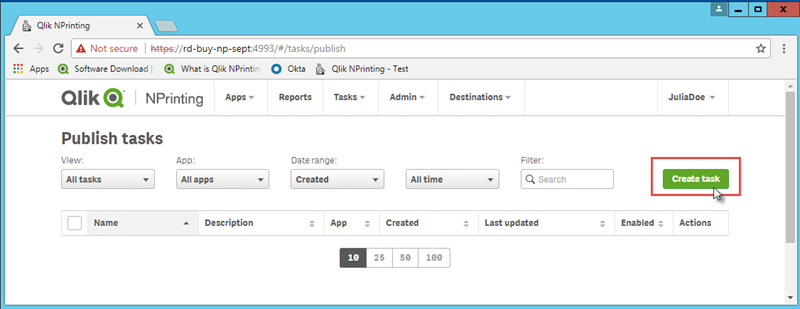
- Enter a name. For example: Publish Beginner's Tutorial NP PowerPoint.
- Select your app from the drop-down list: Beginner's Tutorial NP App - QV.
- Leave the default values for the other options. Click Create.
- Click on the Reports tab.
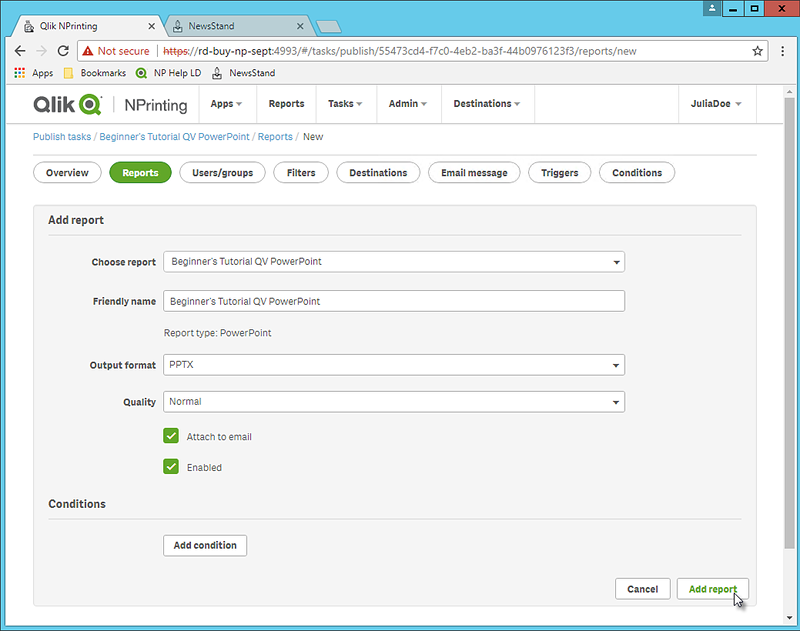
- Click the Add report button.
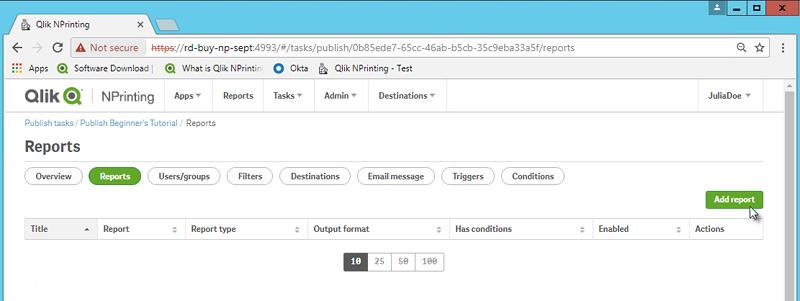
- Select Beginner's Tutorial - NP PowerPoint from the Choose report drop-down list.
- Select PPTX from the Output format drop-down list.
- Ensure that the Attach to email and Enabled check boxes are selected.
- Click Add report.
- Click the Add report button.
- Click on the Users/groups tab.
- Click the Add user or group button.
- Select a user or group from the Choose recipient drop-down list.
If you would like to learn how to create new users, see: Creating users.
- Select the Enabled, NewsStand destination, and Email destination check boxes.
- Click Add recipient.
- Click on the Destinations tab.
- In the NewsStand column, click the Publish for all check box.
- In the Email column, click the Publish for all check box.
- Click Save.
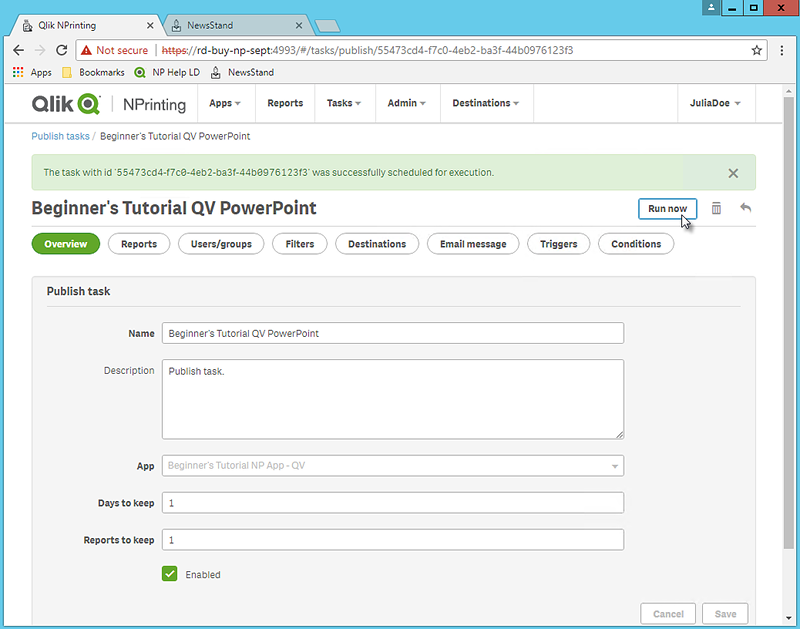
- You will be sent back to the Overview tab.
- Click the Run now button.
Once the task is completed, a confirmation message will appear at the top of the page.
Your recipients can now go to the NewsStand in their browsers and view your report. They will also receive a copy in their email.