Publishing a simple report from a Qlik Sense app
This tutorial will show you how to create and publish a simple Qlik NPrinting Excel report using Qlik Sense data.
Qlik NPrinting has many features. This tutorial is meant to help newer users create their first report. It does not outline every report type, design element, or publishing option. At the end of this tutorial, you will have created, edited, and published an Excel report that is viewable by your selected users.
Other Qlik NPrinting tutorials:
- Publishing a simple report from a QlikView document
- Publishing a complex report from a Qlik Sense app
In this tutorial, you will be:
Accessing a Qlik Sense app
Reports need data. Learn how to download and import a sample Qlik Sense app.
Connecting Qlik NPrinting to a Qlik Sense app
Qlik NPrinting needs to connect to your Qlik Sense app. Learn how to configure Qlik NPrinting so it can access the sample app, or your existingQlik Sense data.
Creating a new Qlik NPrinting report template
Report templates control the layout and output formats of reports. This section will show you how to make a new one.
Editing the report template
Reports offer many different formatting options. In this section, you will add a title, image, table, and level to your report.
Publishing to NewsStand and email
NewsStand is a web console your users can access to view reports. Learn how to publish your report to the NewsStand and by email.
Accessing a Qlik Sense app
Qlik Sense apps contain the data and visualizations that Qlik NPrinting uses to build reports. There are a few different ways to access a Qlik Sense app.
- You can download a Qlik Sense app from the Qlik help site, and upload it to your Qlik Sense Apps folder.
- You can use your own Qlik Sense app, and skip to Connecting Qlik NPrinting to a Qlik Sense app . If you are using your own app to complete this tutorial, pick a simple one. Qlik NPrinting experiences longer load times with complex Qlik Sense apps.
Downloading a Qlik Sense app from the Qlik help site and importing it in Qlik Sense
Do the following:
- On the Qlik NPrinting help site, go to Sample files, and download the Sample file - Beginning with the Basics .zip file to your preferred location on your computer.
- In Windows, unzip the folder. Beginner's tutorial.qvf is your Qlik Sense file.
- Send the app to your system administrator, and ask them import Beginner’s tutorial.qvf into the QMC.
- Ask your system administrator to publish the app to a stream you can access. They can publish to the default stream, Everyone.
You will now be able to see the Beginner's tutorial app in your Qlik Sense hub.
Connecting Qlik NPrinting to a Qlik Sense app
Now we will create a Qlik NPrinting app and connect it to your Qlik Sense app.
A Qlik Sense app and a Qlik NPrinting app are very different:
- Qlik Sense app: contains data, and uses visualizations to explore that data.
- Qlik NPrinting app: contains reports, filters, and the connection to a Qlik Sense app or QlikView document.
Qlik NPrinting apps let the Qlik NPrinting Designer access your Qlik Sense data so that information can be used in a report.
Do the following:
- Log into the Qlik NPrinting web console.
- On the main menu, click the Apps drop-down, and click Apps.
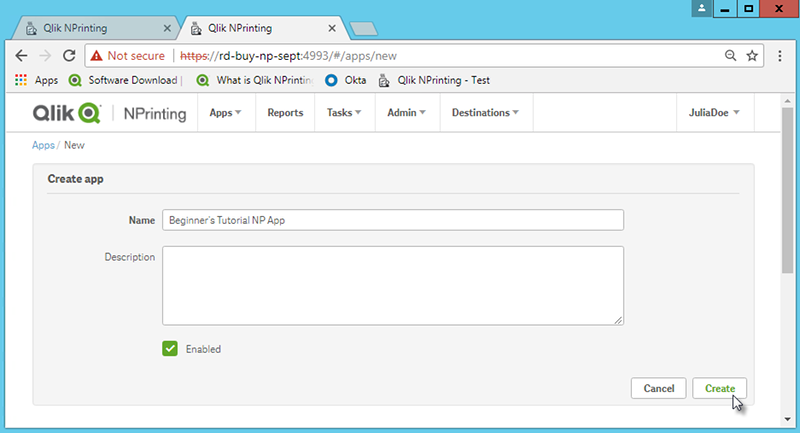
- Click the Create app button.
- Enter a name for this new app. For example: Beginner's Tutorial NP App.
- Ensure the Enabled check box is selected. Otherwise, your app will be ignored by the Qlik NPrinting Engine.
- Click Create.
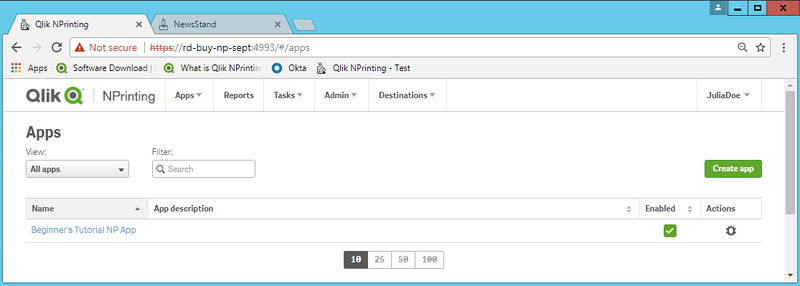
You will now be able to see Beginner's Tutorial NP App under Apps.
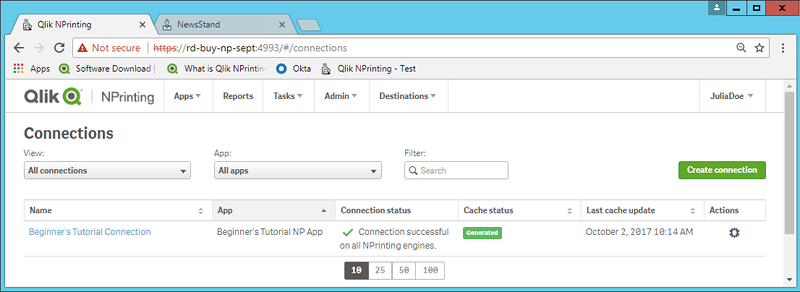
- From the main menu, click the Apps drop-down, and click Connections.
- Click the Create connection button.
- In the Name box, enter a name for the connection: Beginner's Tutorial Connection.
- In the App drop-down list, select the Qlik NPrinting app that you created previously: Beginner's Tutorial NP App.
- Select Qlik Sense as your Source.
- Enter the following information:
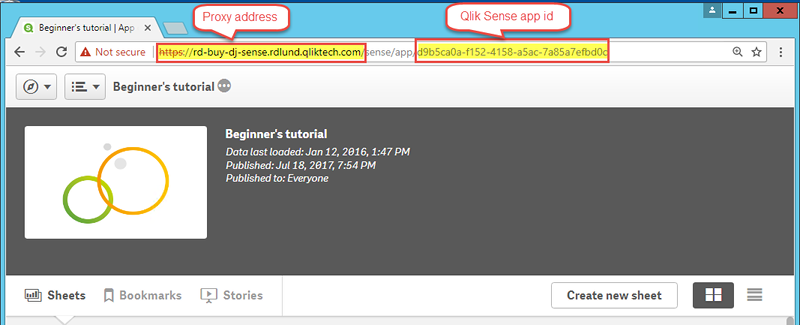
- Proxy address: the full computer name of the Qlik Sense server. You can find this in the Qlik Sense hub, in your browser's address bar. The format is: https://sense_proxy_computer_name.domain_name.
- Qlik Sense app id: This information is available in the Qlik Sense hub, in your browser's address bar, on your app's overview page.
Identity: the <Windows domain name>\<user name> of the Qlik Sense user who has access to the app.
- Click the Run verification button. This ensures your connection is valid.
If the connection is valid, you will see a "Verification successful" message. If not, you will see the following message: "Errors detected. Check details below."
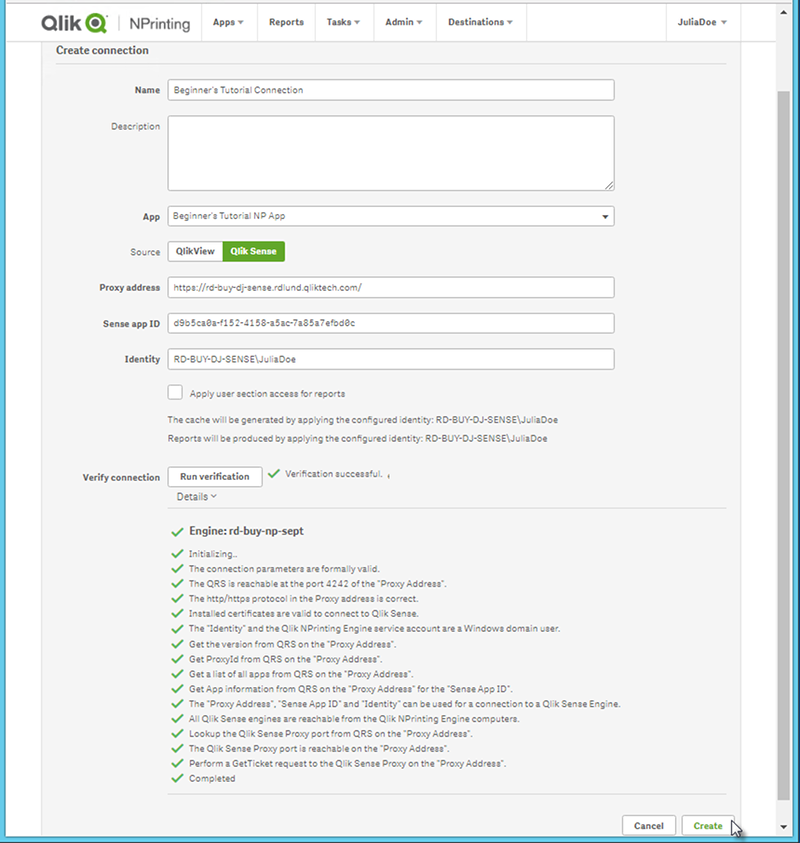
- Once your connection settings have been verified, click Create. You will be automatically moved back to the Connections menu.
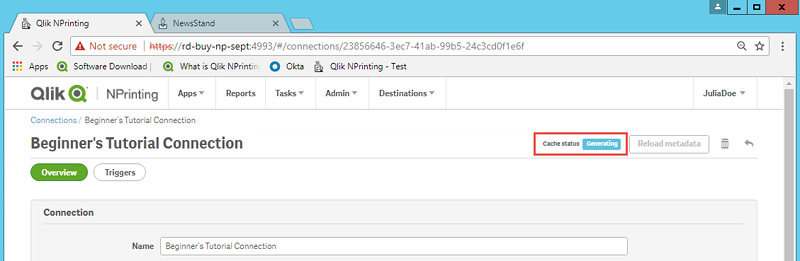
- Click on your new connection. You will see the status: Cache status - Generating. This means that Qlik NPrinting is connecting to Qlik Sense and importing metadata. If you have a large Qlik Sense app, this may take several minutes.
 Information note
Every time you add new objects to your Qlik Sense app, you must reload your connection metadata.
Once the cache status shows Generated, you can create a new report template. If you get an Error status, check your connection information.
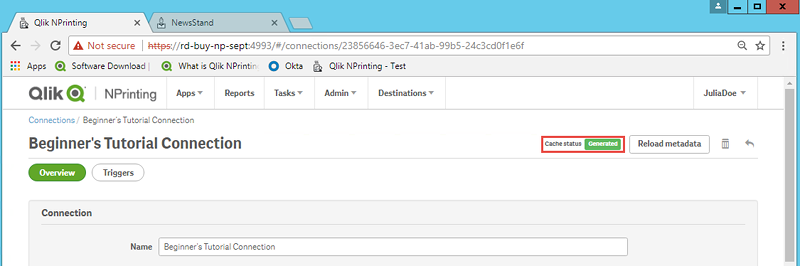
You will now be able to see your new connection on the Connections screen.
If you have trouble connecting to your Qlik Sense app, see:
Creating a new Qlik NPrinting report template
Report templates control the layout and output formats of reports. You can arrange objects and format pages using the standard options of the report type you choose. For example, an Excel report will have the same formatting options and interface as an Excel worksheet.
Do the following:
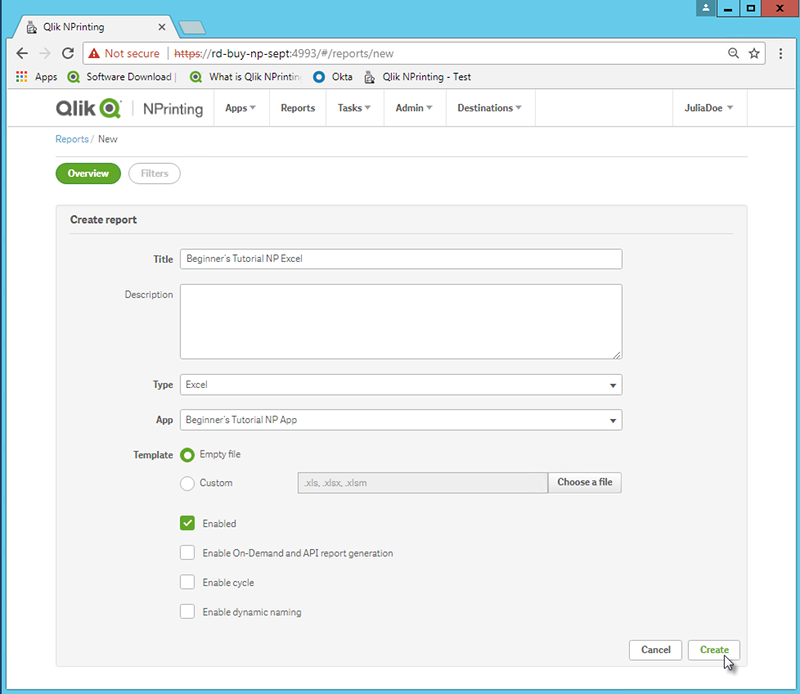
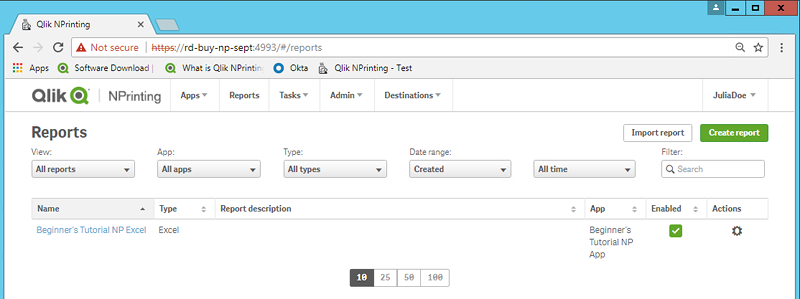
- In the Qlik NPrinting web console, click Reports on the main menu.
- Click the Create report button.
- Enter a title in the Title field. For example: Beginner's Tutorial NP Excel.
- From the Type drop-down list, select Excel.
- From the App drop-down list, select Beginner's Tutorial NP App.
- From the Template options, click Empty file.
- Ensure the Enabled check box is selected. Otherwise, your report will be ignored by the Qlik NPrinting Engine.
- Click Create.
You will now be able to see Beginner's Tutorial NP Excel under Reports.
Editing the report template
There are many ways to edit a report template. We will be adding:
- Titles: simple text used to organize your report. They can be altered using standard Excel formatting.
- Levels: sub-divide your data by a dimension. They can be applied to tables and images. We will be dividing Top 5 Customers by Region.
- Tables: take your Qlik Sense data and present it in tabular form.
- Images: take your Qlik Sense data and present it as a .png.
This section does not cover everything you can do in the Qlik NPrinting Designer. If you would like to read about advanced Excel report features, see: Excel reports.
Do the following:
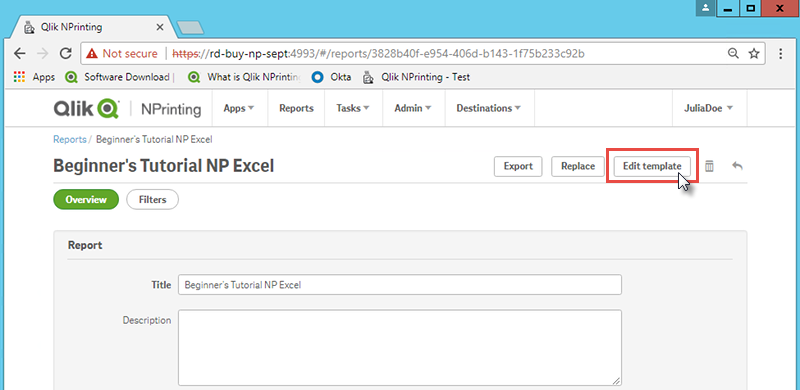
- In the Qlik NPrinting web console, click Reports on the main menu.
- On the Reports screen, click on your report.
- Click the Edit template button to open the Qlik NPrinting Designer template editor.
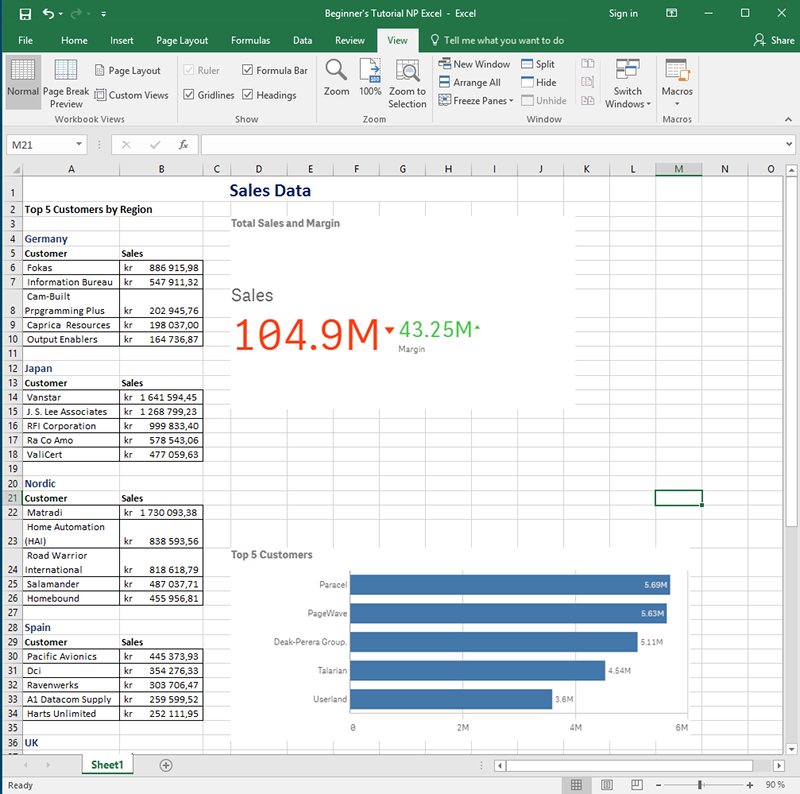
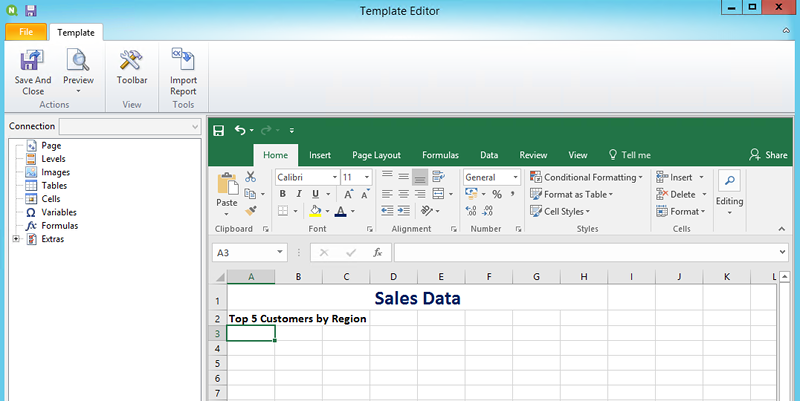
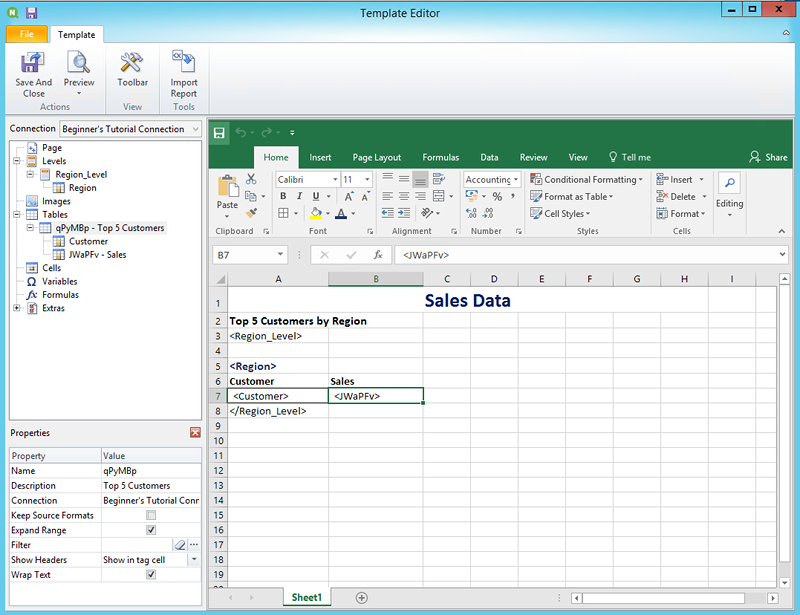
- Enter a title:
- In cell A1, type in a title: For example, "Sales Data".
- In cell A2, type in a subtitle: "Top 5 Customers by Region".
 Tip note You can use Excel formatting options to change the look of these titles. For example, you can change the font size and color. You can also merge several cells together so that the title is centered with the rest of the report.
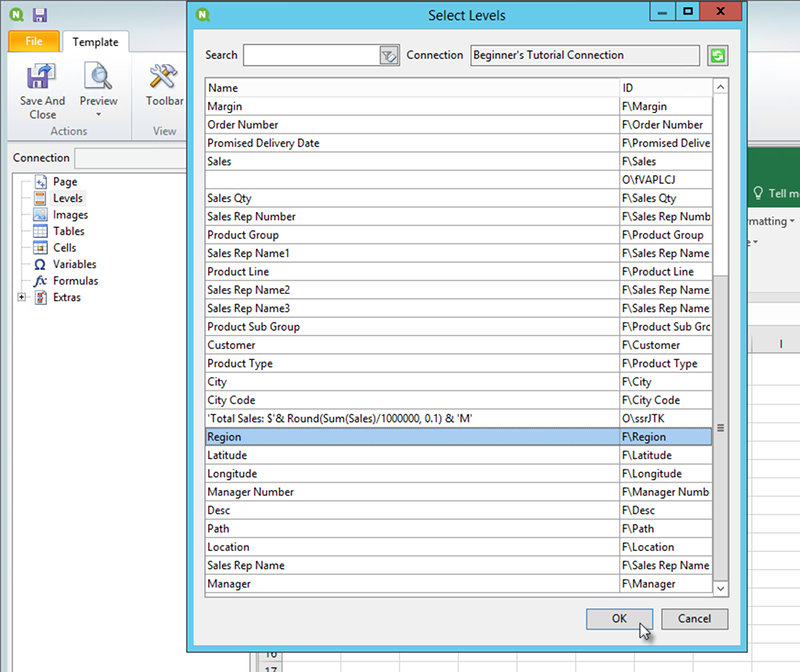
- Add a level:
- On the left pane, right-click on Levels, and select Add levels.
- A new window will open. Select Region. Click OK.
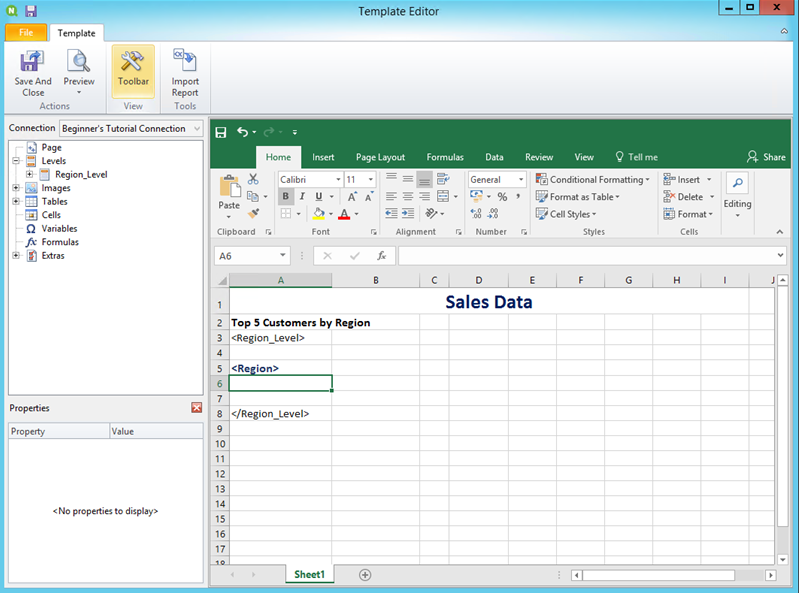
- Drag Region_Level to cell A3.
- Insert three rows beneath A3 to ensure you have four empty cells between the <Region_Level> and </Region_Level> tags.
- Expand Region_Level in the left pane.
- Drag and drop Region onto cell A5.
This ensures that each level has a heading.
- Add a table:
- On the left pane, right-click on Tables, and select Add objects.
- A new window will open. Select Top 5 Customers. Click OK.
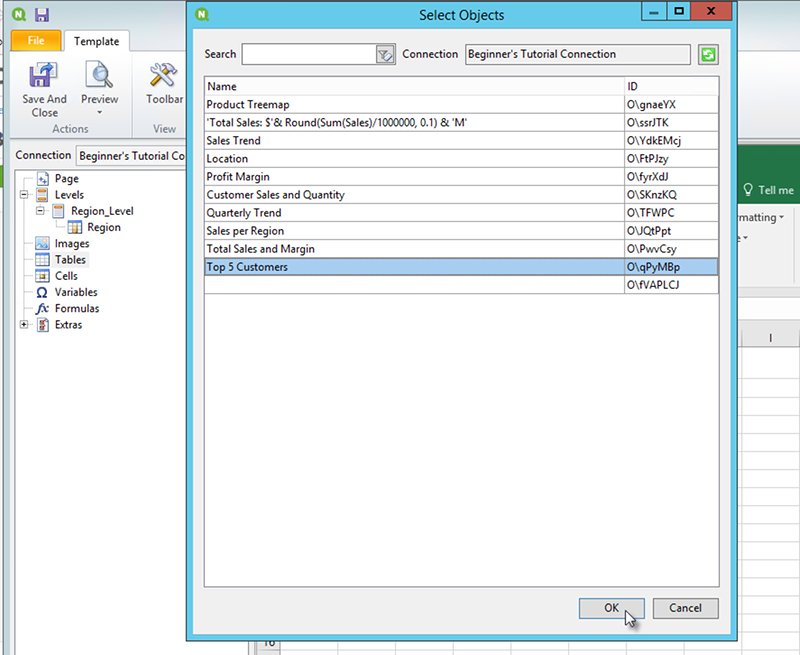
- Right-click on the new node labeled qPyMBp - Top 5 Customers. Click Properties.
- On the Properties pane, ensure that Keep Source Formats is not selected.
- Expand qPyMBp - Top 5 Customers. Drag Customer to cell A6, and drag JWaPFv_1 - Sales to B6.
These two table objects should be inside the two levels tags. You can format them the same as a table by adding a border or background color.
- Click on cell B6. On the Home tab, go to Number, and select the Accounting Number Format icon. This ensures that the data from JWaPFv_1 - Sales displays as currency.
- Add images:
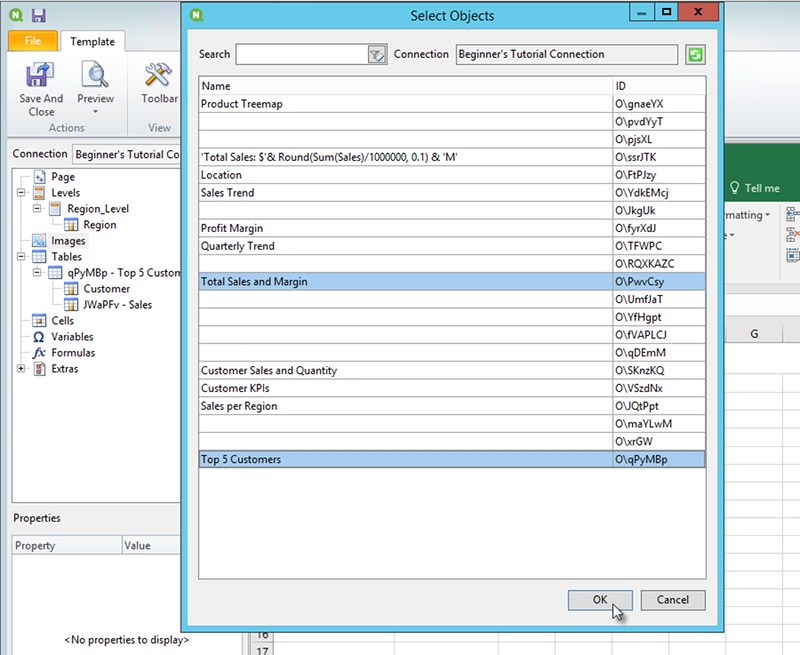
- On the left pane, right-click on Images, and select Add objects.
- A new window will open. Select Top 5 Customers and Total Sales and Margin, and click OK.
You can select multiple options by holding down the CTRL button.
- Click on the new node labeled PwvCsy - Total Sales and Margin and drag it to cell D3. Click on qPyMBp_1 - Top 5 Customers and drag it to cell D7.
Because these are images, trying to format them using Excel formatting options will have no effect.
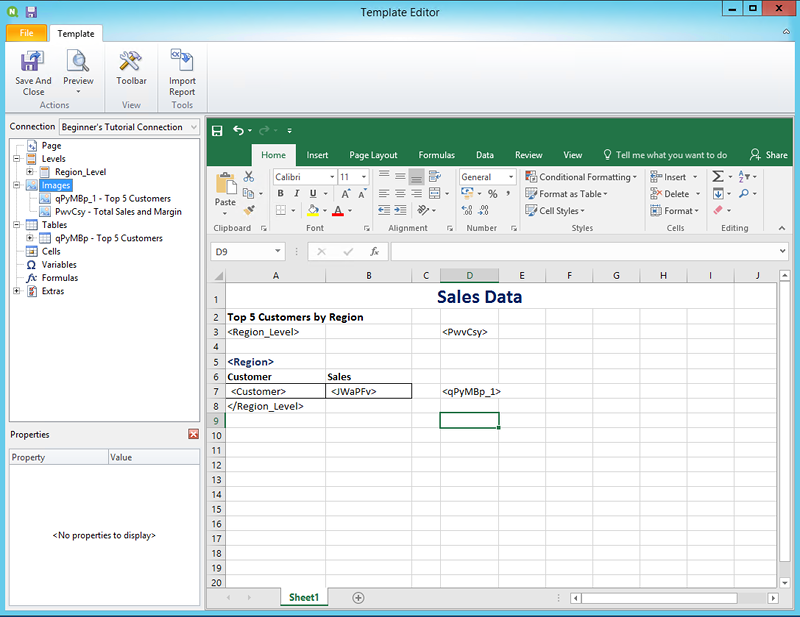
- On the Excel toolbar, click the Page Layout tab.
- Click the Orientation drop-down, and select Landscape.
Report types with many tables that span length-wise will display more clearly in landscape.
- On the Qlik NPrinting template editor menu, click the File tab. Click Save.
- Click the Template tab, and click the Preview button to preview your report.
It may take several minutes for your preview to load, depending on the size of your report.
Warning noteEdits done in preview mode will not be saved. - If you would like to continue editing, close the preview window, and format your report in the template editor.
- When you are finished editing, click Save And Close.
The report template is now saved and ready to be shared with users.
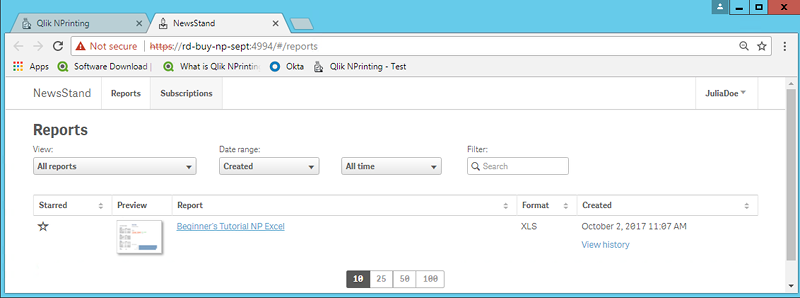
Publishing to NewsStand and email
Reports need to be published in order for users to access them. We will be publishing to NewsStand and by email.
NewsStand is a web portal that allows users to preview and download reports, and subscribe to automatic updates. See: NewsStand overview
Emails contain your reports as attachments. Their contents can be customized by adding text and images. See: Distributing reports by email.
Do the following:
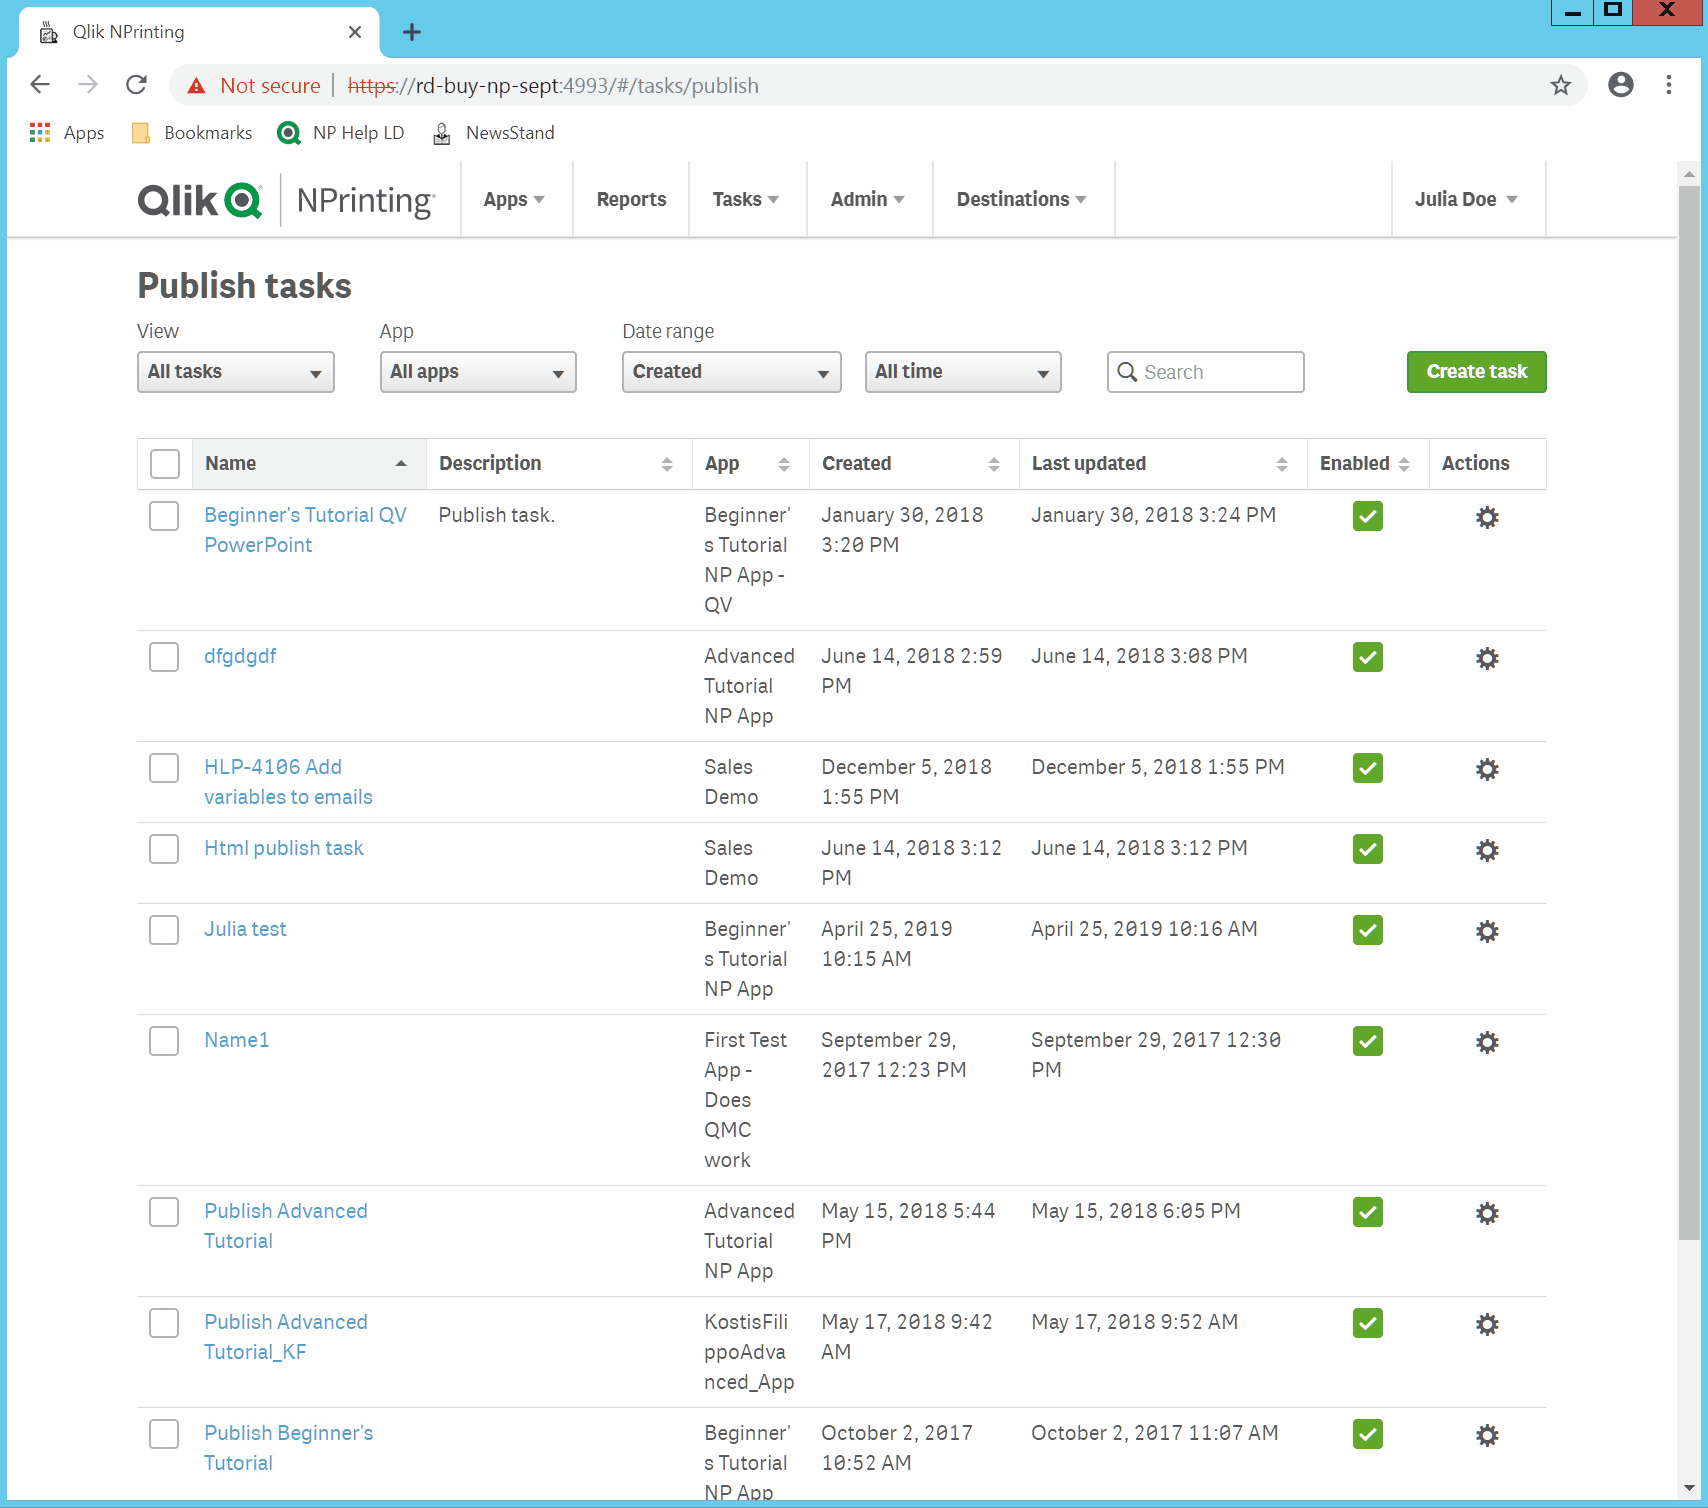
- In the Qlik NPrinting web console, click Tasks on the main menu, and select Publish task.
- Click the Create task button.
- Enter a name.
- Select your app from the drop-down list: Beginner's Tutorial NP App.
- Leave the default values for the other options. Click Create.
- Click on the Reports tab.
- Click the Add report button.
- Select Beginner's Tutorial - NP Excel from the Choose report drop-down list.
- Select XLS from the Output format drop-down list.
- Make sure that the Attach to email and Enabled check boxes selected.
- Click Add report.
- Click on the Users/groups tab.
- Click the Add user or group button.
- Select a user or group from the Choose recipient drop-down list.
If you would like to learn how to create new users, see:Creating users.
- Select the Enabled, NewsStand destination, and Email destination check boxes.
- Click Add recipient.
- Click on the Destinations tab.
- In the NewsStand column, click the Publish for all check box.
- In the Email column, click the Publish for all check box.
- Click Save.
- You will be sent back to the Overview tab.
- Click the Run now button.
A confirmation message will appear at the top of the page.
Your recipients can now go to the NewsStand in their browsers and view your report. They will also receive a copy in their email.