
Creating Excel pivot tables
You can create Excel pivot tables using Excel table columns or levels.
Qlik Sense pivot tables can only be added as images in Qlik NPrinting. QlikView pivot tables can be added as images and straight tables. Neither can be converted into an Excel pivot table in your reports. If you have a pivot table that you want to reproduce in an Excel report, you can do one of two things:
- Convert the original pivot table to a straight table.
- Clone your pivot table and convert the clone to a straight table.
Creating a pivot table using Excel table columns
We recommend using Excel table columns to create pivot tables in Excel reports. It is easier than using levels, and does not slow down report generation.
Requirements
To create a pivot table in the Qlik NPrinting Designer, you need:
- Excel 2007 or later
- A Qlik Sense or QlikView straight table
What you will do
You will:
- Add a QlikView straight table as a table object to an Excel report.
- Build a table column by column.
- Convert that table to a pivot table.
This tutorial uses QlikView data that can be found on Sample files. You can also use your own Qlik Sense or QlikView data.
Creating a new Excel report
Do the following:
- Select Reports in the Qlik NPrinting main menu, and then click Create report.
- Enter a Title for the report.
- Select Excel from the Type drop-down list.
- Select an app from the App drop-down list.
- Click Create to create the report.
- Click Edit template to open the Template Editor.
Adding a chart object as a table column by column
Do the following:
- Right-click the Tables node, and select Add objects.
- Select the Connection that contains the straight table.
-
Select a table object. For example: Straight Country - Salesman - Year. Click OK.
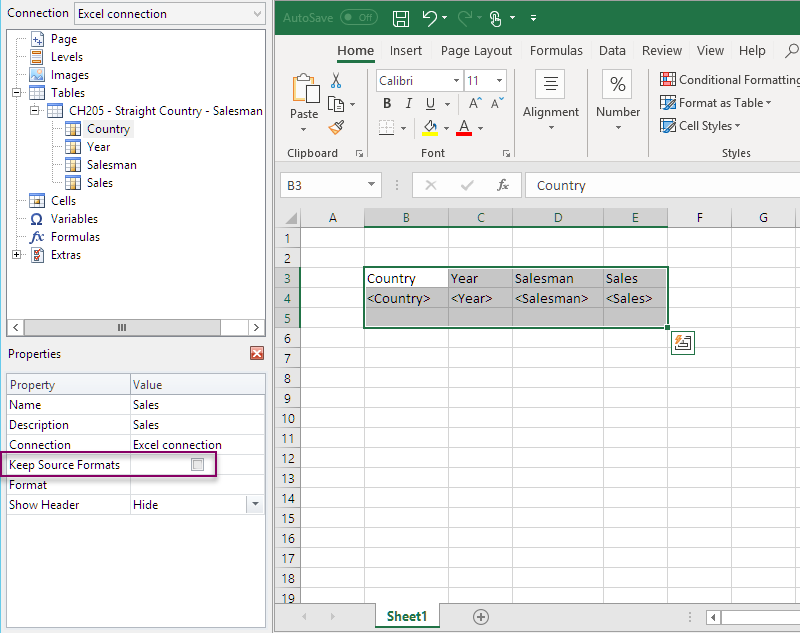
- In the Tables node, select Straight Country - Salesman - Year.
- In the Properties pane, clear Keep Source Formats.
-
Click the + next to Straight Country - Salesman - Year.
This expands the table node, and displays all table columns.
- Hold Shift or CTRL and select the columns you want to add. In this example, select all four table fields.
-
Drag the columns onto the template.
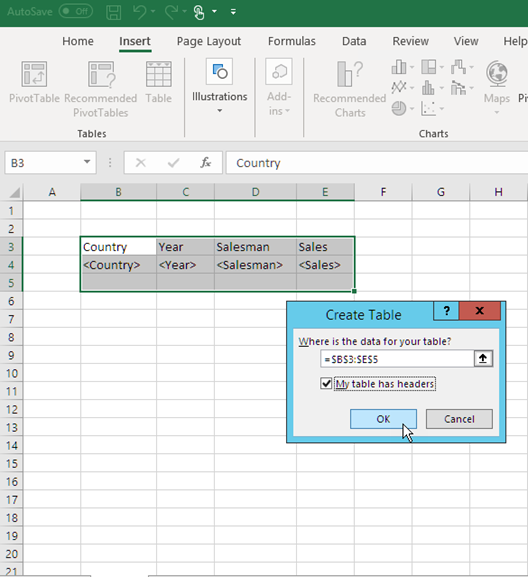
- Highlight the column headings, table tags, and one empty row below.
- On the Excel ribbon, click the Insert tab.
- In the Tables group, click Table .
-
Make sure the My table headers box is selected. Click OK.
-
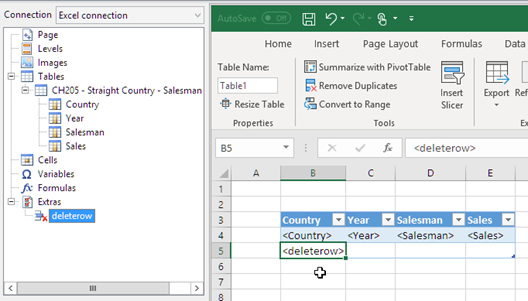
On the left pane, click Extras. Drag a deleterow tag onto a cell in the empty row below the table.
This will remove the empty row from the final report.
Converting to a pivot table
Do the following:
- Highlight the heading and table field cells.
- On the Excel ribbon, under Table Tools, click the Design tab.
-
In the Tools group, click Summarize with PivotTable.
-
In the Create PivotTable window, click OK.
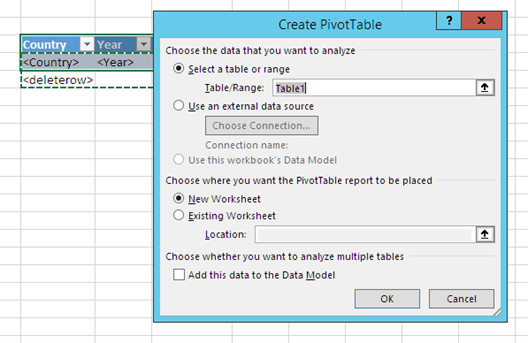
A pivot table is created in a new worksheet. You can also add the pivot table to the same worksheet and hide the column with the data.
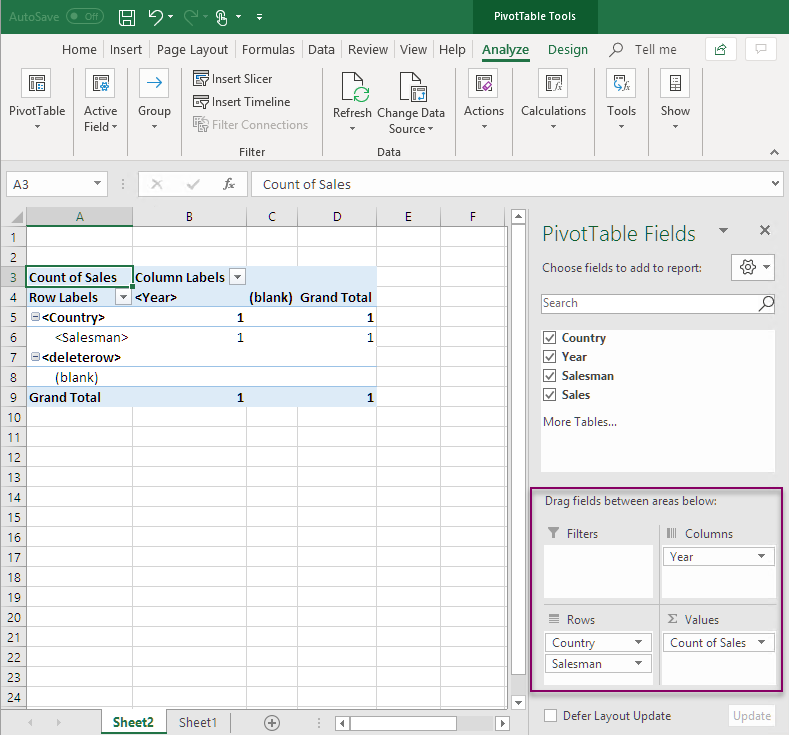
- Drag the Year field into the Columns box.
- Drag the Salesman and the Country fields into the Row Labels box.
-
Drag the Sales field into the Values box.
-
Click Count of Total sales to open the drop down menu. Select Value Field Settings.
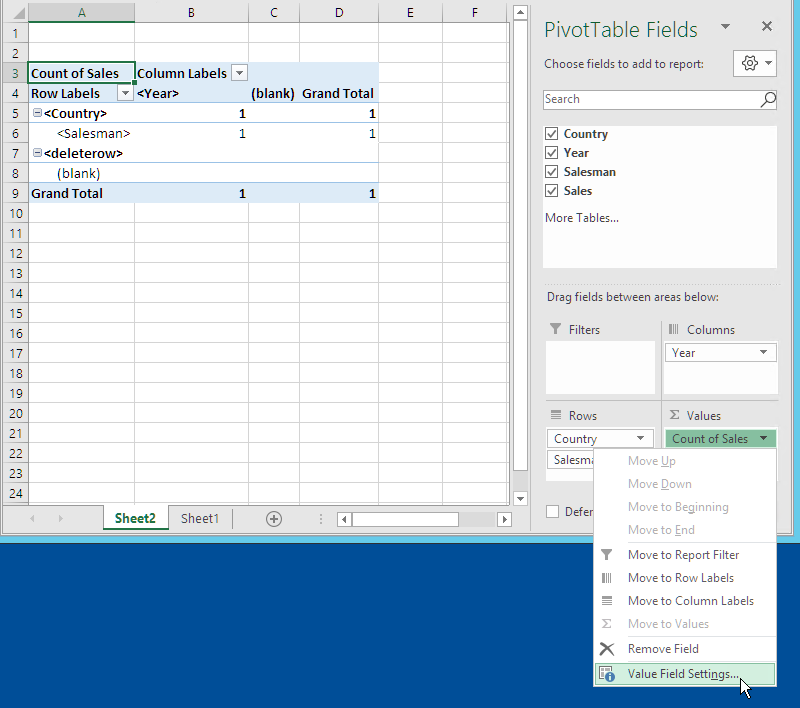
- On the Summarize Values By tab, select Sum. Click OK.
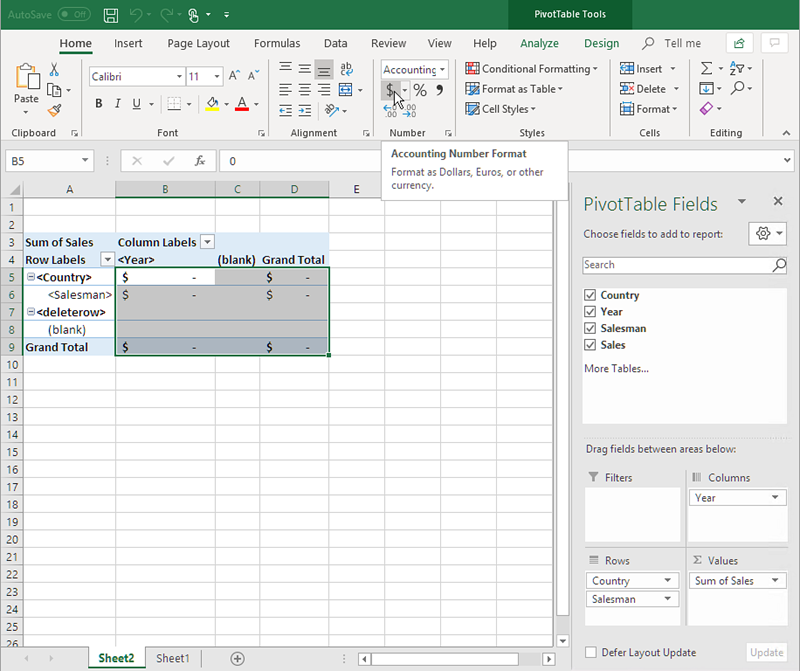
-
Select the cells in the table that contain Sales values. Format them as currency.
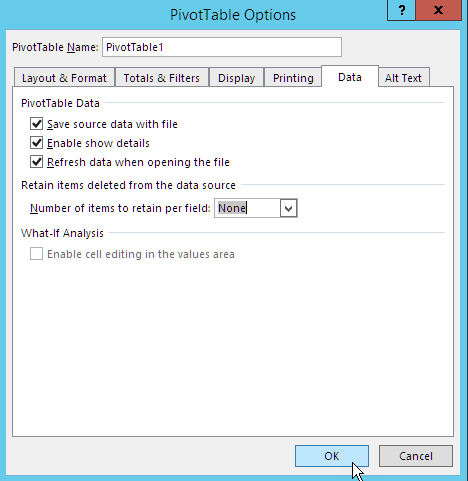
Ensuring data is refreshed when report is opened
If you do not perform these steps, you will see an empty pivot table in the generated report.
Do the following:
- Under the PivotTable Tools - Analyze tab. On the left, click the Options drop down menu .
- Select the Data tab.
- Click the Refresh data when opening the file check box.
- Set Number of items to retain per field to None.
-
Click OK.
Previewing the report
Do the following:
-
Click Preview.
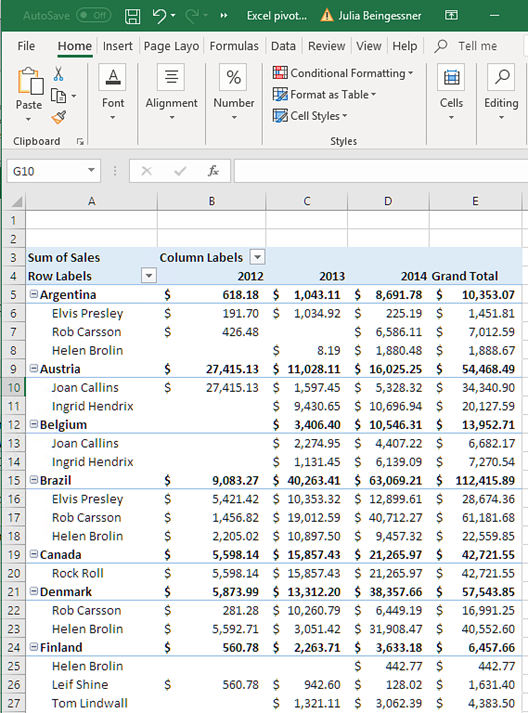
Excel launches and displays your report.
-
You will have a report with a pivot table.
- Click Save and Close to save the template, and close the Template Editor.
Creating a pivot table using levels
You can use levels to make pivot tables, but this will slow down report generation time. You should only use this method if you have a version of Excel (2003 and earlier) that does not support adding table columns.
What you will do
- Add a QlikView straight table as a level object to an Excel report.
- Build a table using levels.
- Convert that table to a pivot table.
This tutorial uses QlikView data that can be found on Sample files. You can also use your own Qlik Sense or QlikView data.
Adding levels to the template
Do the following:
-
Open an existing Excel report, or create a new one.
See: Creating
- Right-click the Levels node, and select Add levels.
- Select Straight Country - Salesman - Year in the levels list. Click OK.
-
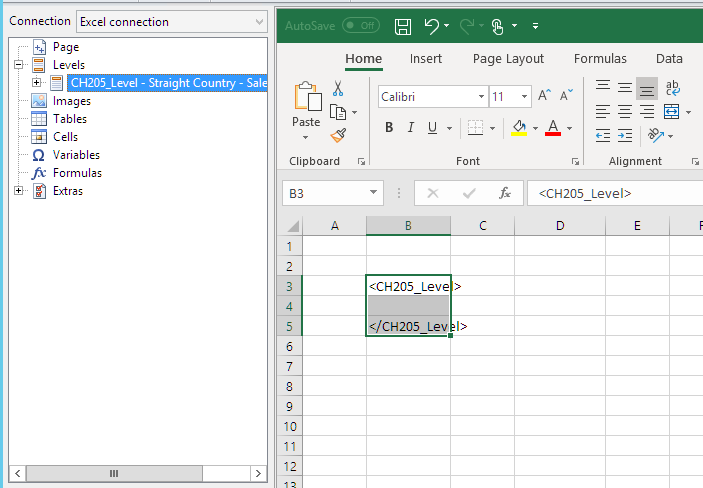
Drag the CH205_Level - Straight Country-Salesman-Year node onto empty template cells. This will create opening and closing tags for the level.
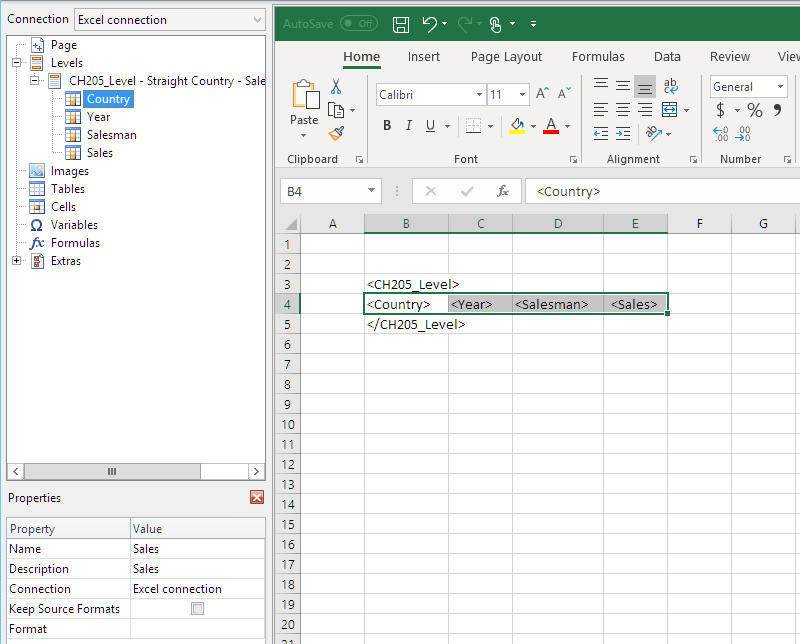
- Click the + next to the CH205_Level - Straight Country-Salesman-Year node.
- Drag the Country, Salesman, Year, and Sales nodes onto empty cells on rows between the <CH205_Level> and </CH205_Level> tags.
In the Properties pane, ensure that Keep Sources Formats is unchecked for all four of these objects.
-
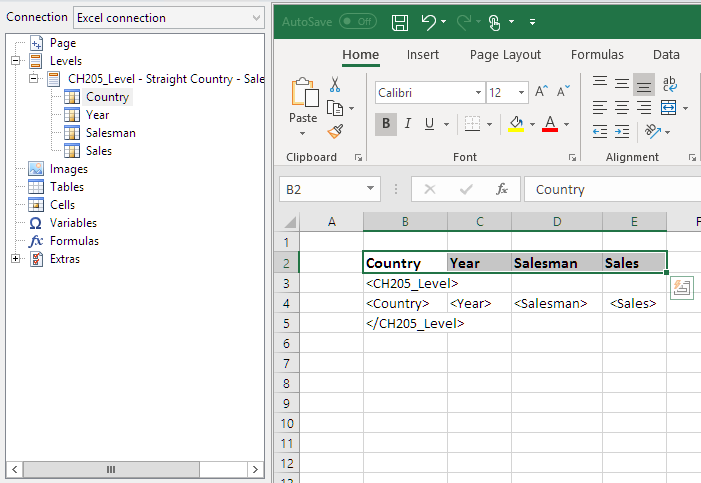
Type in headings for the columns in the row above the <CH205_Level> tag.
You can use QlikView objects that have calculated dimensions or null values as levels. However, you cannot nest other objects inside them, except for fields from that sheet object. Qlik Sense visualizations with calculated dimensions cannot be used as levels.
Creating a pivot table
Do the following:
- Select the range of cells that includes:
- the headings
- the <CH205_Level> opening tag
- the column tags
- the </CH205_Level> closing tag
- On the Excel ribbon, select the Insert tab. In the Tables group, select PivotTable.
-
In the Create PivotTable window, click OK.
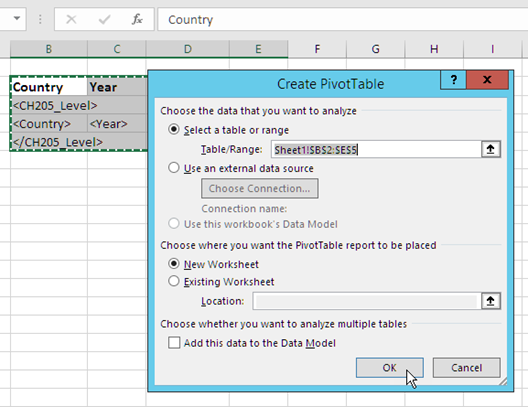
A pivot table is created in a new worksheet. You can also add the pivot table to the same worksheet and hide the column with the data.
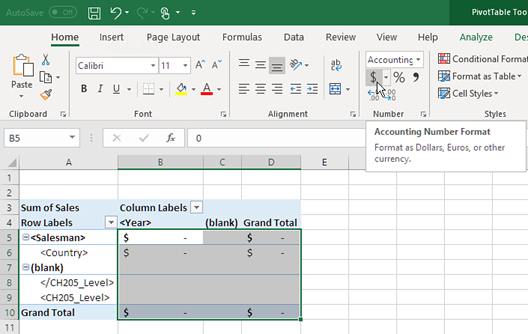
- Drag the Country and Salesman fields into the Row Labels box.
- Drag the Year field into the Column Labels box.
-
Drag the Sales field into the Values box.
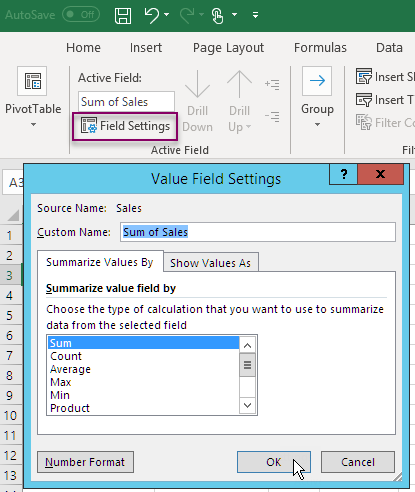
- In the Active Field group, click the Field Settings button.
-
Change the value in the Summarize Values By tab to Sum. Click OK.
-
Select the cells in the table that contain Sales values. Format them as currency.
Ensuring data is refreshed when report is opened
If you do not perform these steps, you will see an empty pivot table in the generated report.
Do the following:
- Under the PivotTable Tools - Analyze tab. On the left, click the Options drop down menu .
- Select the Data tab.
- Click the Refresh data when opening the file check box.
- Set Number of items to retain per field to None.
-
Click OK.
Previewing the report
Do the following:
-
Click Preview.
Excel launches and displays your report.
-
You will have a report with a pivot table.
- Click Save and Close to save the template, and close the Template Editor.