Viewing model scores
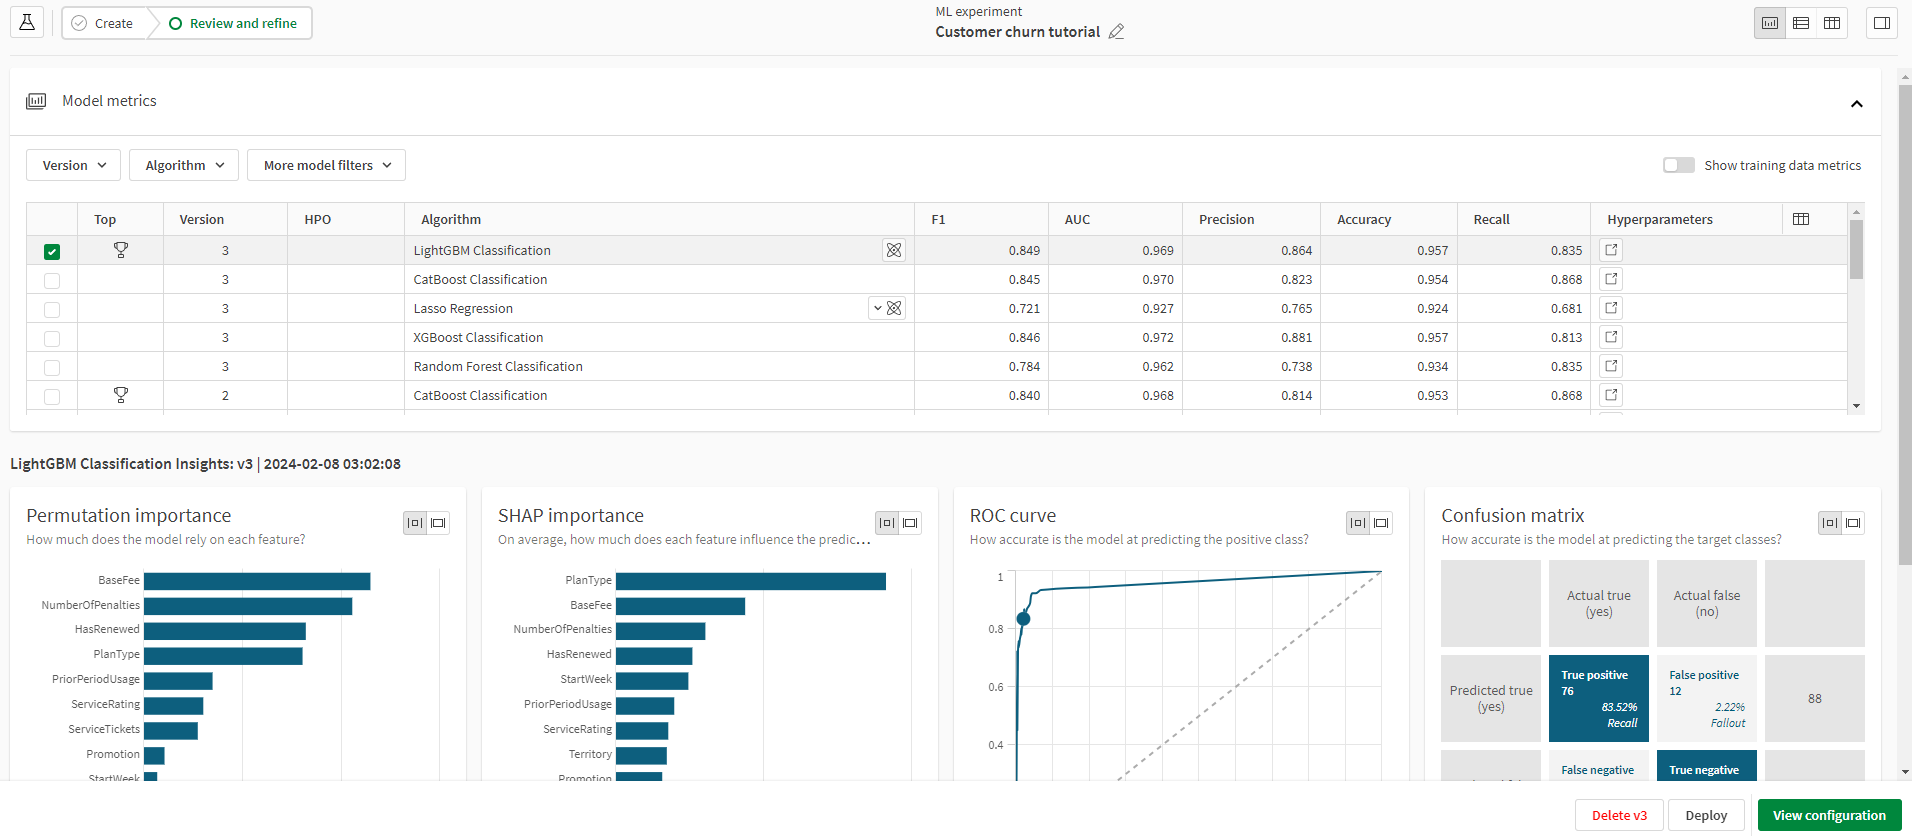
The model view shows a collection of insights from the training of machine learning algorithms. Metrics and charts let you compare different models within an experiment version or between different experiment versions. Review the metrics to find out how well the model performed and how you can refine the model to improve the score.
The best fitting algorithm for an experiment version is automatically selected and is marked with . The rating is based on the F1 score in classification models and the R2 score in regression models.
If a model has already been deployed into an ML deployment, click the icon to open the deployment. If one or more deployments have been created from the same model, click
and then
to open the desired ML deployment.
The model view with metrics table and chart visualizations lets you review model performance

Showing metrics in table
Different metrics are available depending on the type of machine learning problem.
Do the following:
-
In the top right of the Model metrics table, click
.
-
Select the metrics you want to show.
Viewing model metrics
There are multiple filters you can use when viewing model metrics. Expand the dropdown menus located directly above the Model metrics table to explore the filter options for your models.
You can filter models by experiment version and algorithm used. To include the metrics for the top-performing model, use the Top performers filter. The Selected model filter will include model metrics for the model you have selected. Use the Deployed filter to include metrics for models that have been deployed.
When combining filters, the model metrics that match any of the filters applied will be shown.
Reviewing a model

Comparing holdout scores and training scores
The metrics displayed in the model view are based on the automatic holdout data that is used to validate model performance after training. You can also view the training metrics that were generated during the cross-validation and compare with the holdout metrics. Toggle Show training data metrics on or off to show columns for the training data model scores. These scores will often be similar, but if they vary significantly there is likely a problem with data leakage or overfitting.
Do the following:
-
In the Model metrics table, select a model.
-
Click Show training data metrics.
Model metrics table with holdout and training data metrics

Viewing hyperparameter values
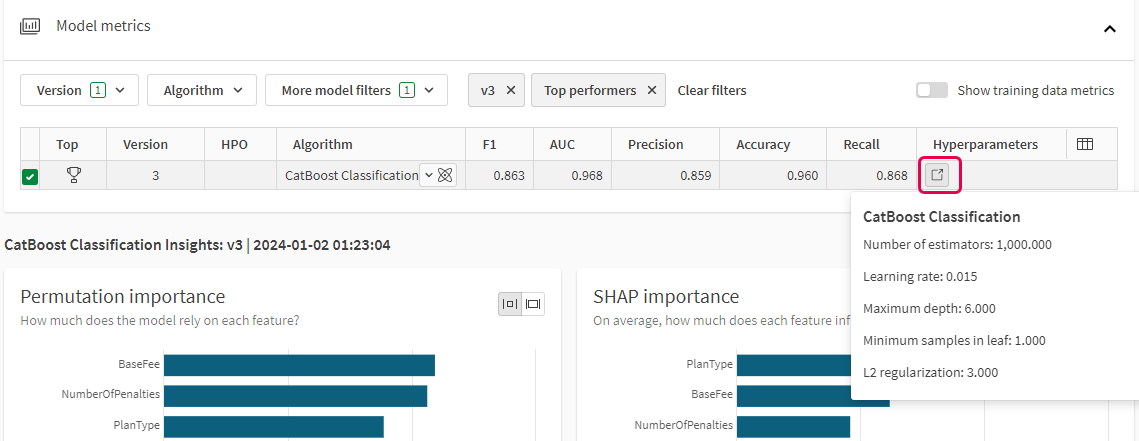
You can view the hyperparameter values used for training by each algorithm. For more information about hyperparameters, see Hyperparameter optimization.
Do the following:
-
In the Model metrics table, click
in the Hyperparameters column.
The hyperparameter values are shown in a pop-up window.
View hyperparameter values

Viewing experiment configuration
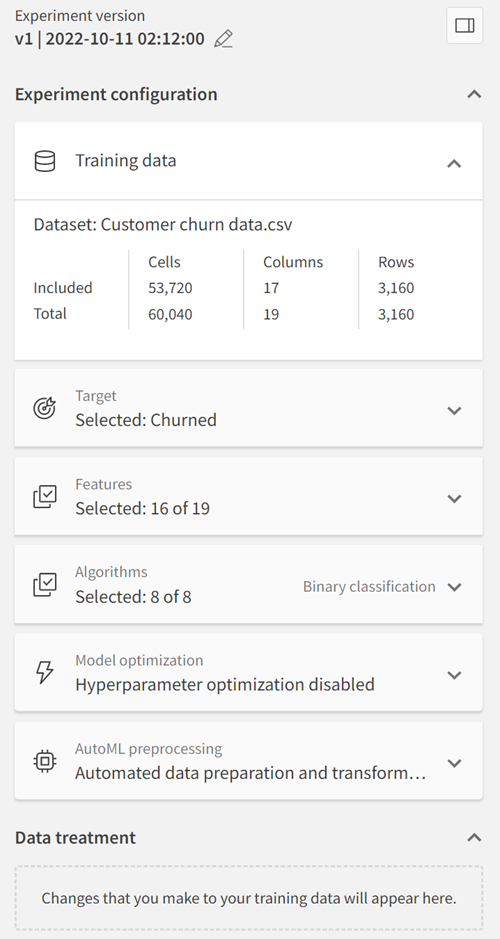
The Experiment configuration pane shows the experiment version configuration for the currently selected model.
Do the following:
-
Select a model in an experiment version.
-
Click
or View configuration to open the Experiment configuration pane.
Experiment configuration

