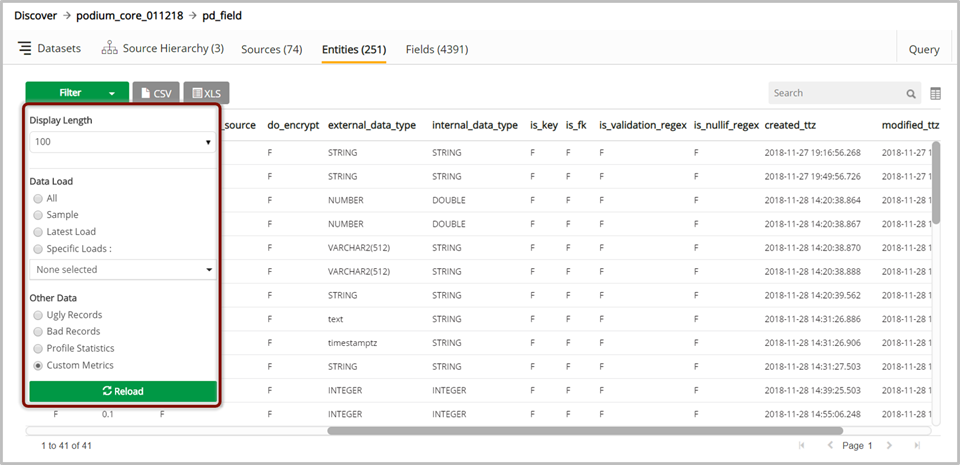
Sample data and data load filter
Sample data and other filtered views can be observed from entity and field grids in discover. Qlik Catalog creates a sample directory upon creation of entities for inclusion in publish or prepare flows. Sample data probability can be set in core_env.properties (default.record.sampling.probability) or at source or entity level properties (record.sampling.probability) with a default value of .01 (at all levels). Entity level value can over-ride source level value which can over-ride the global value set in core_env.properties.
To set the sample probability of the entire original dataset to include all records specify a value of 1.0.
To include half of the records, specify a value of .5.
To set the sample set to none (no sample records) specify a value of 0.
Filter options:
- The filter provides Display Length options (100 | 1000 | 2000 | 3000)
- Data Load (All | Sample | Latest Load | Specific Loads: {Search on Available Loads})
- Other Data (Ugly Records | Bad Records | Profile Statistics | Custom Metrics)
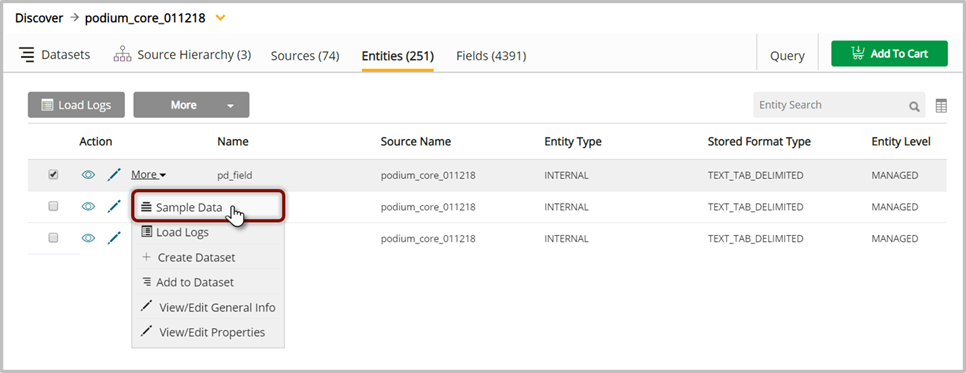
In discover, select Sample Data from the More dropdown screen to open the Sample Data and Data Load Filter.
The filter opens to the Sample Data screen by default; user can specify Display Length for Data Load or Other Data selections.
|
Sample Records |
If the entity has sample records in its latest load, those will show up if this filter has been applied. If there are no sample records the message "No data available in table" displays. Only sample records from the latest load can be viewed and no previous history is available for this filter selection. The columns of the table are the same as the entity fields. Note that this option is disabled for Addressed entities. The following default filters will be in place around sample data:
|
|
Ugly Records (field data is problematic) |
If the entity has ugly records in its latest load, those will show up if this filter has been applied. If there are no ugly records the message "No data available in table" displays. Only ugly records from the latest load can be viewed and no previous history is available for this filter selection. The columns of the table are the same as the entity fields. Note that this option is disabled for Registered and Addressed entities. |
|
Bad Records (record structure conflict) |
If the entity has bad records in its latest load, those will show up if this filter has been applied. If there are no bad records, the message "No data available in table" displays. Only bad records from the latest load can be viewed and no previous history is available for selection. The table has a single column record which contains the bad record as a string. Note that this option is disabled for Registered and Addressed entities. |
|
Profile Statistics (data profile metric) |
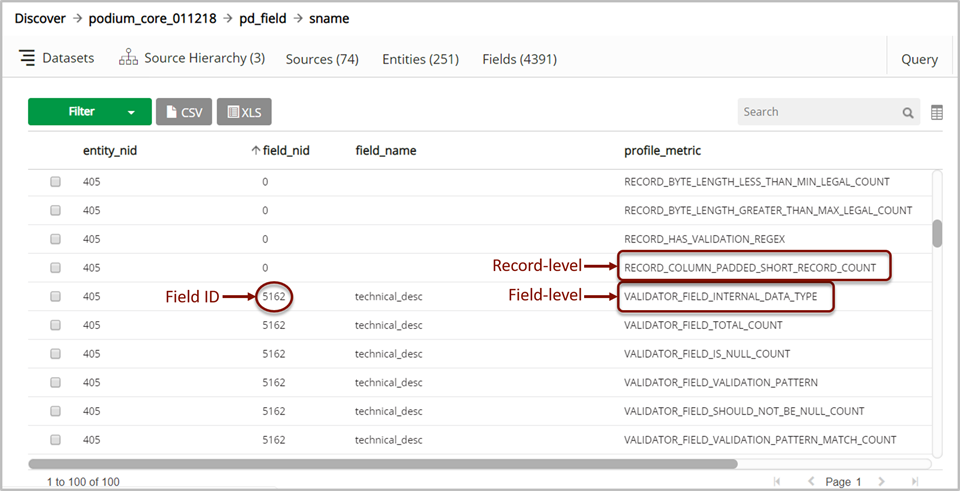
The profile statistics from the latest load are shown if this filter has been applied, no previous history of statistics is available for selection. The table has 6 columns: entity_nid, field_nid, field_name, profile_metric, field_value, metric_value. Note that the entity_nid, field_nid and field_name refer to the nids (NID=Numeric Identifier) and names of the external entity and field respectively and not the internal entity/fields in discover. This option is disabled for Addressed entities. |
Profile Statistics: Note that Profile Statistics are field-level metrics unless the statistic name begins with Record (ex. RECORD_BAD_COUNT).
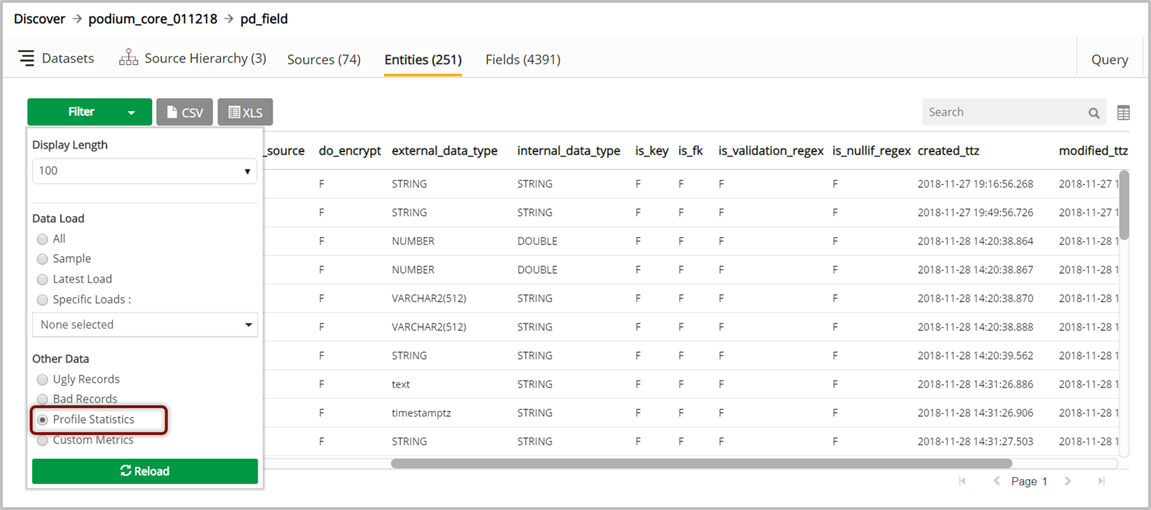
Field-level metrics are identifiable by Field_nid column and prefixed with VALIDATOR_ or PROFILER_
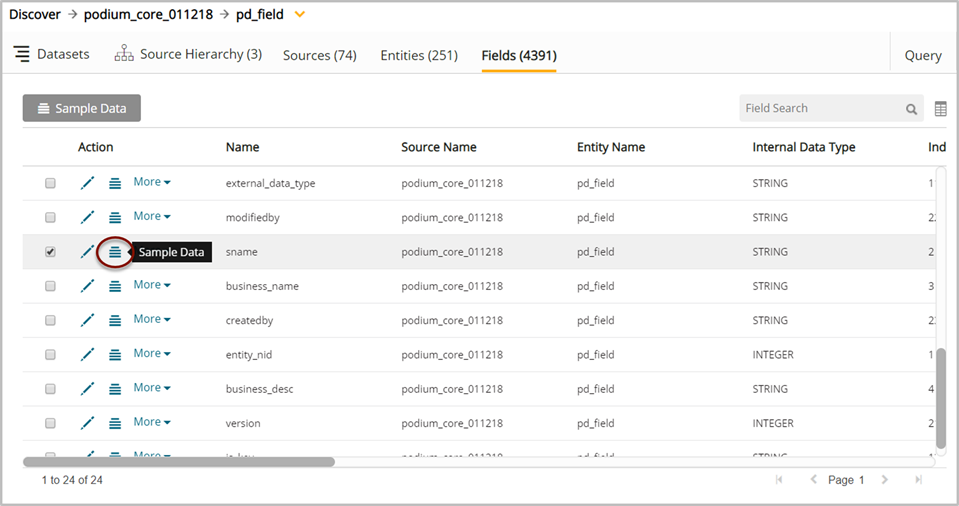
Select field Sample Data: Select  (sample data) icon.