Key Performance Indicators
Data KPIs are a key component of the Marketplace Dashboard. KPIs measure entities on business and health objectives like performance, operational effectiveness, and popularity.
KPIs can be calculated from any given metric using data from HDFS, local file system, profile data, metadata, or other external references such as server access logs.
The application ships with three standard KPIs intended as a starting point for customers to define their own custom logic to meet specific performance or quality objectives. KPIs for an entity are computed or refreshed after every data load or dataflow finishes—the KPI calculation is performed as a post-process so does not impact the success or failure of the load or dataflow execution.
KPI display
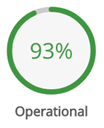
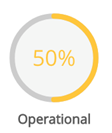
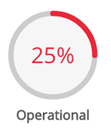
KPI colors provide a quick gauge of how an Entity scores on the following thresholds.
|
Color |
Score |
Meaning |
|---|---|---|
|
Green
|
68%-100% |
Good or Great. Meets business objective. |
|
Yellow
|
34%-67% |
Risky or Ok. Needs attention or is not performing optimally. |
|
Red
|
1%-33% |
Below acceptable threshold or not performing relative to other entities. This may not be a meaningful score if the business value of the data source is not reflected by the KPI. For example, an entity may get a low popularity score when the components driving the score (such as number of tags or frequency of publish or prepare jobs) are not relevant or valuable measures for that entity. |
|
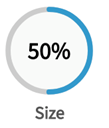
Blue (QVD only)
|
1-100% |
Blue is used to indicate Size for QVDs; this metric does not indicate relative performance (good/bad) but simply a percentage size of the current QVD relative to the largest known QVD currently in the system.
|
KPI scoring metrics for non-QVD entities
Score: Operational (total 100%)
| Component | Weight | Loads | Description/calculation |
|---|---|---|---|
|
Recency |
50% |
All loads within defined Time Intervals |
Computes the difference between now and the last load relative to overall period activity. (Now - Last_Load_Date_Time) < Period where Period = Last_Good_Load_date_Time - First_Good_Load_Date_Time)/Number_of_Loads [in days]] If the value of the first expression is less than the overall period, the value=1 (in sync/recent), if the value of the first expression is greater, the value=0 (not as recent, i.e., entity has not loaded and run recently relative to its history). Range of values= 1 or 0 |
|
Percent Finished Loads |
50% |
All loads within defined Time Intervals |
Loads that finished (not failed) / total number of loads: (# Finished loads) / total # loads |
Score: Quality (total 100%)
| Component | Weight | Loads | Description/calculation |
|---|---|---|---|
|
Percent Bad Records |
30% |
Last Load for snapshot entity type/ Aggregate for Incremental entity type |
Percentage of bad records to total records: Bad_Records/Total_Records |
|
Percent Ugly Records |
70% |
Last Load for snapshot entity type/ Aggregate for Incremental entity type |
Percentage of ugly records to total records: Ugly_Records/Total_Records |
Score: Popularity (total 100%)
| Component | Weight | Loads | Description/calculation |
|---|---|---|---|
|
Number of Tags |
15% |
N/A |
Count of tags compared to average: 0.5 + ((# tags for the entity - Average_Tags) / Average_Tags) *0.5) If above is greater than 1, set value=1 If above is less than 1, set value=0 |
|
Number of Comments |
20% |
N/A |
Count of comments compared to average: 0.5 + ((# comments for the entity - Average_Comments) / Average_Comments) *0.5) If above is greater than 1, set value=1 If above is less than 1, set value=0 |
|
Prepare Jobs |
15% |
N/A |
Count of prepare jobs executed including entity compared to average: 0.5 + ((# prepare jobs using the entity - Average_Prepare_Jobs) / Average_Prepare_Jobs) *0.5) If above is greater than 1 set to 1 |
|
Publish Jobs |
50% |
N/A |
Count of publish jobs executed including entity compared to average: 0.5 + ((# publish jobs using the entity - Average_Publish_Jobs) / Average_Publish_Jobs) *0.5) If above is greater than 1 set to 1 |
KPIs for QVDs
KPIs for QVDs are slightly different than KPIs for regular (non-QVD) entities. Quality for example, is not applicable to QVDs and so has been replaced with Size KPI (which indicates relative file size and number of records), a relevant metric for QVDs as they are ingested into memory, so size is relevant. Operational and popularity metrics have the same names and similar meanings to non-QVD entities but the backend calculations are somewhat different.
Score: Operational (total 100%)
|
Component |
Weight |
Description/calculation |
|---|---|---|
| Recency |
100% |
Computes the difference between now and the last load and compares that to the typical update frequency. This metric will be N/A (not applicable) until Qlik Catalog sees the first refresh coming from Qlik Sense. Arguments: Components Last_Load_Date_Time: Last time the QVD was loaded on Qlik Sense First_Load_Date_Time: Time the QVD is synced on Qlik Sense upon QVD ingestion Typical Period (typical interval between updates): (Last_Load_Date_Time - First_Load_Date_Time)/Number_of_Loads Latest Period: Now - Last_Load_Date_Time Number of Loads: Number of times the QVD was loaded on Qlik Sense since first QDC ingest If Number_of_Loads=1 THEN Recency is N/A If Latest_Period <= Typical_Period THEN Recency = 1 (100%) If Latest_Period > Typical_Period THEN Recency =.5 If (Latest_Period - Typical_Period) / Typical_Period<=0 THEN Recency =0 All variables in these calculations refer to QVD generation in Qlik Sense, NOT the loads of QVD metadata into QDC. |
Score: Size (total 100%)
|
Component |
Weight |
Description/calculation |
|---|---|---|
|
Size Volume |
50% (# records in QVD - smallest # records across all QVDs) / (largest # records across all QVDs - smallest # records across all QVDs) If all QVDs have the same number of records (unlikely)=1 |
Relative size of the QVD in memory/storage units (file size on disk) (QVD Size - Smallest QVD Size) / (Largest QVD Size - Smallest QVD Size) If all QVDs are the same size (unlikely)=1 |
|
Size Records |
50% |
Relative size of the QVD in number of records |
Score: Popularity (total 100%)
|
Component |
Weight |
Description/calculation |
|---|---|---|
|
Number of Tags |
15% |
Count of tags compared to average (includes both tags imported from Qlik Sense and tags created in Qlik Catalog) Average Tags=Total # of tags across all QVDs / # of QVDs 0.5 + ((# tags for the QVD - Average_Tags) / Average_Tags) *0.5) If above is greater than 1 = 1 If Average_Tags is 0 = 0 |
|
Number of Comments |
20% |
Count of comments (Qlik Catalog comments, previously known as "blog") compared to average Average Comments=Total # of comments across all QVDs / # of QVDs 0.5 + ((# comments for the QVD - Average_Comments) / Average_Comments) *0.5) If above is greater than 1 = 1 If Average_Comments is 0 = 0 |
|
Number of Publish Jobs |
65% |
Count of Publish jobs executed including QVD compared to average Average Publish Jobs= Total # of executed Publish jobs across all QVDs / # of QVDs 0.5 + ((# executed Publish jobs using the QVD - Average_Publish_Jobs) / Average_Publish_Jobs) *0.5) |
Behavior and configuration of KPI metrics
The metrics defined in the metadata are automatically computed for an Internal entity or prepare target at the time of ingestion or dataflow execution. However, if any or all metric computations fail, the data load or dataflow execution can still complete successfully after the reason for the failure is logged. Therefore, to refresh scores, reload the entity or re-run the dataflow.
- KPI computation can be turned off for an entity or source by enabling the KPIs at entity and source levels or setting global core_env property: enable.kpi=true (default)
- To configure a defined time window in which to capture loads, the following property can be set globally in core_env.properties (unit of measure= days): metric.computation.window=60 (default). Setting this value to a negative number (e.g.,"-1" ) will use all historical loads to compute metrics.
- To configure the time period in days for which the historical custom entity metrics are retained, the following property can be set globally in core_env.properties (unit of measure=days): metric.retention.window=60 (default). Setting this value to a negative number (e.g.,"-1”) will delete all historical metrics keeping only the current (latest) ones.


